1.0.0: DEA Intertidal Elevation (Landsat)
1.0.0: DEA Intertidal Elevation (Landsat)
National Intertidal Digital Elevation Model 25m 1.0.0
- Version:
1.0.0 (See latest version)
- Product types:
Derivative, Raster
- Time span:
1986 – 2016
- Update frequency:
As needed
- Next update:
No updates planned
- Product ID:
nidem
Old version
This is an old version of the product. See the latest version.
About
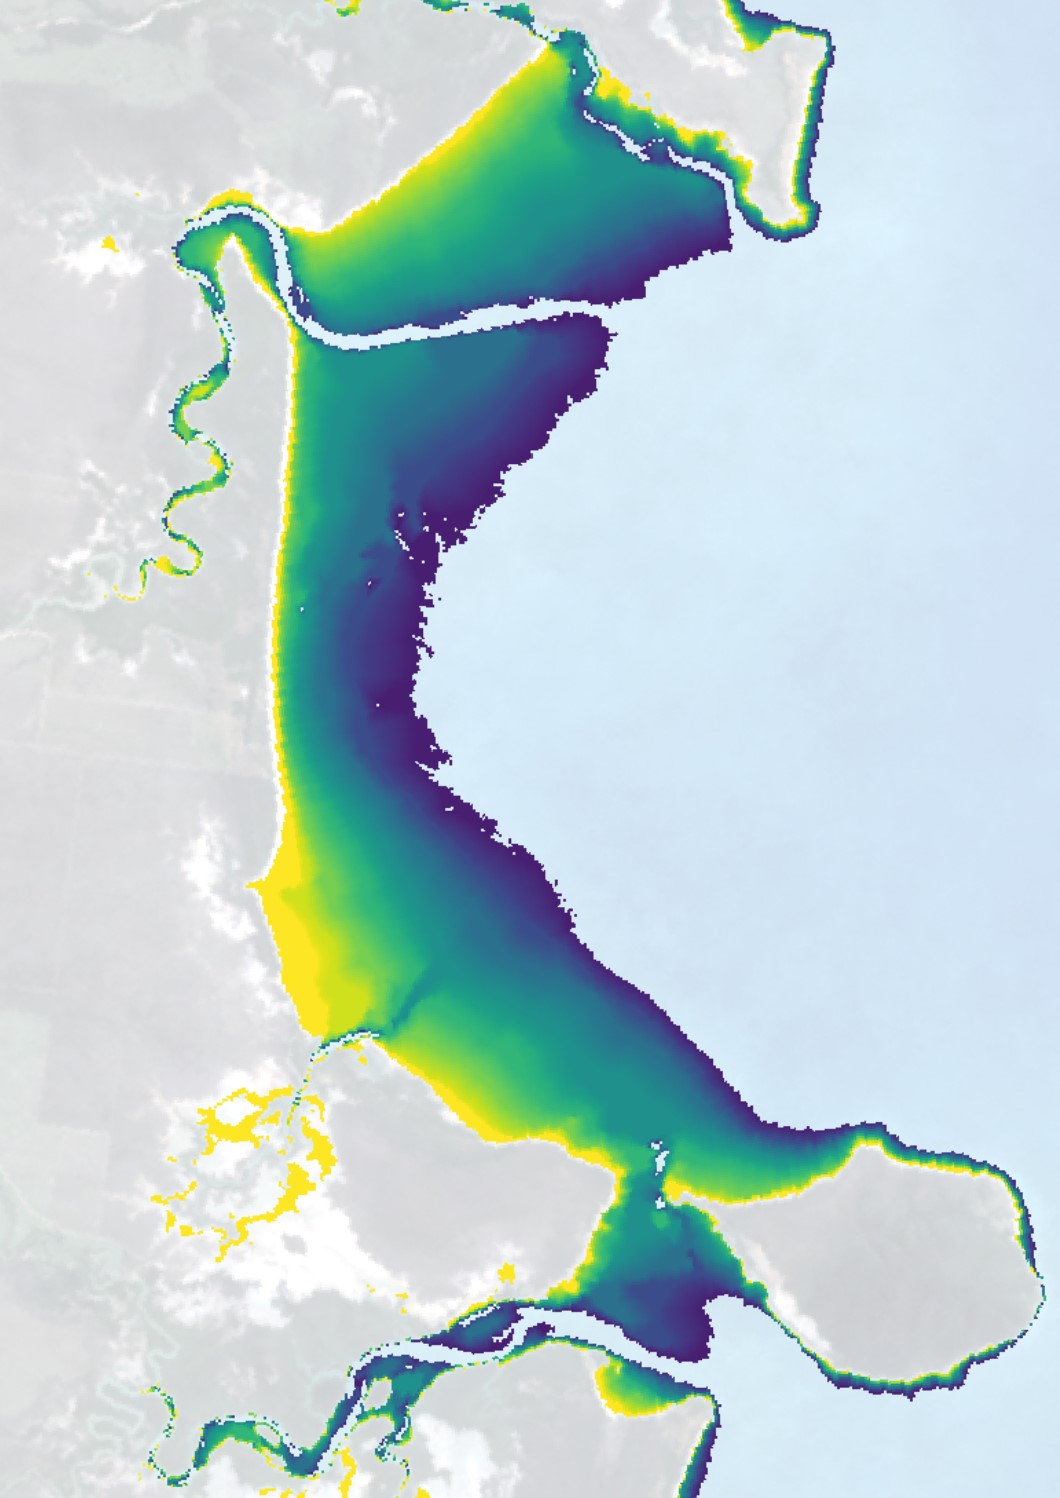
Digital Earth Australia (DEA) Intertidal Elevation maps Australia’s intertidal zone — the area between the highest tide mark and the lowest — in 3D, providing 25 m resolution elevation data for our sandy beaches, tidal flats, rocky shores and reefs.
Access the data
For help accessing the data, see the Access tab.
See it on a map
Data explorer
Access the data on AWS
Access the data on NCI
Web Map Service (WMS)
Key details
Parent product(s) |
|
Collection |
Geoscience Australia Landsat Collection 2 |
Persistent ID |
|
Licence |
Cite this product
Data citation |
Bishop-Taylor, R., Sagar, S., Lymburner, L. 2018. National Intertidal Digital Elevation Model 25m 1.0.0. Geoscience Australia, Canberra. http://dx.doi.org/10.26186/5c4fc06a79f76
|
Paper citation |
Bishop-Taylor, R., Sagar, S., Lymburner, L., Beaman, R.L., 2019. Between the tides: modelling the elevation of Australia's exposed intertidal zone at continental scale. Estuarine, Coastal and Shelf Science. https://doi.org/10.1016/j.ecss.2019.03.006
|
Publications
Bishop-Taylor, R., Sagar, S., Lymburner, L., & Beaman, R. J. (2019). Between the tides: Modelling the elevation of Australia’s exposed intertidal zone at continental scale. Estuarine, Coastal and Shelf Science, 223, 115–128. https://doi.org/10.1016/j.ecss.2019.03.006
Background
Intertidal environments support important ecological habitats (e.g. sandy beaches and shores, tidal flats and rocky shores and reefs), and provide many valuable benefits such as storm surge protection, carbon storage and natural resources for recreational and commercial use.
Intertidal zones are faced with increasing threats from coastal erosion, land reclamation (e.g. port construction), and sea level rise. Accurate elevation data describing the height and shape of the coastline is needed to help predict when and where these threats will have the greatest impact. However, this data is expensive and challenging to map across the entire intertidal zone of a continent the size of Australia.
What this product offers
The National Intertidal Digital Elevation Model (NIDEM) is a continental-scale elevation dataset for Australia’s exposed intertidal zone.
This product provides the first three-dimensional representation of Australia’s intertidal sandy beaches and shores, tidal flats and rocky shores and reefs at 25 m spatial resolution, addressing a key gap between the availability of sub-tidal bathymetry and terrestrial elevation data.
Applications
Integrating with existing topographic and bathymetric data to seamlessly map the elevation of the coastal zone
Providing baseline elevation data for predicting the impact of coastal hazards such as storm surges, tsunami inundation or future sea-level rise
Investigating coastal erosion and sediment transport processes
Supporting habitat mapping and modelling for coastal ecosystems extending across the terrestrial to marine boundary
Technical information
The National Intertidal Digital Elevation Model (NIDEM) is the first 3D model of Australia’s intertidal zone - the area of coastline exposed and flooded by ocean tides. Intertidal environments support important ecological habitats (e.g. tidal mudflats, sandy beaches and coral reefs), and provide many valuable benefits such as storm surge protection, carbon storage and natural resources for recreational and commercial use. However, intertidal zones are faced with increasing threats from coastal erosion, land reclamation (e.g. port construction), and sea level rise. Accurate elevation data describing the height and shape of the coastline is needed to help predict when and where these threats will have the greatest impact. However, this data is expensive and challenging to map across the entire intertidal zone of a continent the size of Australia.
The rise and fall of the ocean can be used to describe the three-dimensional shape of the coastline by mapping the land-sea boundary (or ‘waterline’) across a range of known tides (e.g. low tide, high tide). Assuming that these waterlines represent lines of constant height relative to mean sea level (MSL), elevations can be modelled for the area of coastline located between the lowest and highest observed tide. To model the elevation of Australia’s entire intertidal zone, 30 years of satellite images of the coastline (between 1986 and 2016 inclusive) were obtained from the archive of spatially and spectrally calibrated Landsat observations managed within the Digital Earth Australia (DEA) platform. Using the improved tidal modelling framework of the Intertidal Extents Model v2.0 (ITEM 2.0; Sagar et al. 2017, 2018), each satellite observation in the 30 year time series could be accurately associated with a modelled tide height using the global TPX08 ocean tidal model. These satellite observations were converted into a water index (NDWI), composited into discrete ten percent intervals of the observed tide range (e.g. the lowest 10% of observed tides etc), and used to extract waterlines using a spatially consistent and automated waterline extraction procedure. Triangulated irregular network (TIN) interpolation was then used to derive elevations relative to modelled mean sea level for each 25 x 25 m Landsat pixel across approximately 15,387 sq. km of intertidal terrain along Australia’s entire coastline.
NIDEM differs from previous methods used to model the elevation of the intertidal zone which have predominately focused on extracting waterlines from a limited selection of satellite images using manual digitisation and visual interpretation (e.g. Chen and Rau 1998; Zhao et al. 2008; Liu et al. 2013; Chen et al. 2016). This manual process introduces subjectivity, is impractical to apply at a continental-scale, and has inherent restrictions based on the availability of high quality image data at appropriate tidal stages. By developing an automated approach to generating satellite-derived elevation data based on a 30 year time series of observations managed within the Digital Earth Australia (DEA) platform, it was possible to produce the first continental-scale three-dimensional model of the intertidal zone.
Features
The National Intertidal Digital Elevation Model (NIDEM) consists of four raster datasets (NIDEM, unfiltered NIDEM, NIDEM mask, NIDEM uncertainty) and two vector datasets (NIDEM waterline contours and ITEM v2.0 tidal modelling polygons). For convenience, the four raster datasets are provided both as individual geotiff/NetCDF files, and continental-scale geotiff mosaics.
NIDEM
The NIDEM dataset provides elevation in metre units relative to modelled Mean Sea Level for each pixel of intertidal terrain across the Australian coastline. The DEMs have been cleaned by masking out non-intertidal pixels and pixels where tidal processes poorly explain patterns of inundation (see NIDEM mask below). This is the primary output product, and is expected to be the default product for most applications. The dataset consists of 306 raster files corresponding to the 306 ITEM v2.0 tidal modelling polygons, and a continental-scale mosaic.
Unfiltered NIDEM
The unfiltered NIDEM dataset provides un-cleaned elevation in metre units relative to modelled Mean Sea Level for each pixel of intertidal terrain across the Australian coastline. Compared to the default NIDEM product, these layers have not been filtered to remove noise, modelling artefacts or invalid elevation values (see NIDEM mask below). This supports applying custom filtering methods to the raw NIDEM data. The dataset consists of 306 raster files corresponding to the 306 ITEM v2.0 tidal modelling polygons, and a continental-scale mosaic.
NIDEM mask
The NIDEM mask dataset flags non-intertidal terrestrial pixels with elevations greater than 25 m, and sub-tidal pixels with depths greater than -25 m relative to Mean Sea Level. Pixels where tidal processes poorly explain patterns of inundation are also flagged by identifying any pixels with ITEM confidence NDWI standard deviation greater than 0.25. The NIDEM mask was used to filter and clean the NIDEM dataset to remove modelling artefacts and noise (e.g. intertidal pixels in deep water or high elevations) and invalid elevation estimates caused by coastal change or poor model performance. The dataset consists of 306 raster files corresponding to the 306 ITEM v2.0 tidal modelling polygons, and a continental-scale mosaic.
NIDEM uncertainty
The NIDEM uncertainty dataset provides a measure of the uncertainty (not to be confused with accuracy) of NIDEM elevations in metre units for each pixel. The range of Landsat observation tide heights used to compute median tide heights for each waterline contour can vary significantly between tidal modelling polygons. To quantify this range, the standard deviation of tide heights for all Landsat images used to produce each ITEM interval and subsequent waterline contour was calculated. These values were interpolated to return an estimate of uncertainty for each individual pixel in the NIDEM datasets: larger values indicate the waterline contour was based on a composite of images with a larger range of tide heights. The dataset consists of 306 raster files corresponding to the 306 ITEM v2.0 tidal modelling polygons, and a continental-scale mosaic.
NIDEM waterline contours
The NIDEM waterline contour dataset provides a vector representation of the boundary of every ten percent interval of the observed intertidal range. These contours were extracted along the boundary between each ITEM v2.0 tidal interval, and assigned the median and standard deviation (see NIDEM uncertainty above) of tide heights from the ensemble of corresponding Landsat observations. These datasets facilitate re-analysis by allowing alternative interpolation methods (e.g. kriging, splines) to be used to generate DEMs from median tide heights. The dataset consists of 306 shapefiles corresponding to the 306 ITEM v2.0 tidal modelling polygons.
ITEM v2.0 tidal modelling polygons
The ITEM v2.0 tidal model polygon dataset describes the multi-resolution tidal framework developed by Sagar et al. (2018). The framework uses partitioning methods to allow spatial variability in the tidal model to drive the size and locations of a Voronoi polygon mesh. The 306 resulting tidal modelling polygons are then used as analysis units for tidal modelling, with tide height predictions defined at the nodes of each Voronoi cell. To evaluate the representativeness of NIDEM data compared to the full tidal range, the spread of tidal heights coincident with the input Landsat imagery was compared against the full range of modelled tide heights present within each tidal modelling polygon. Three indices were calculated: spread (the proportion of the full modelled tidal range observed by Landsat), low tide offset (the proportion of the lowest tidal heights not observed by Landsat) and high tide offset (the proportion of the highest tidal heights not observed by Landsat). This evaluation of the observed tidal range at a particular location provides valuable information to users about the “fitness for purpose” of NIDEM at a given location for their specific application (see Bishop-Taylor et al. 2019).
Lineage
The product differs from previous methods used to model the elevation of the intertidal zone which have predominately focused on extracting waterlines from a limited selection of satellite images using manual digitisation and visual interpretation (e.g. Chen and Rau 1998; Zhao et al. 2008; Liu et al. 2013; Chen et al. 2016). This manual process introduces subjectivity, is impractical to apply at a continental-scale, and has inherent restrictions based on the availability of high quality image data at appropriate tidal stages. By developing an automated approach to generating satellite-derived elevation data based on a 30 year time series of observations managed within the Digital Earth Australia (DEA) platform, we were able to produce the first continental-scale three-dimensional model of the intertidal zone.
Processing steps
Extract waterline contours along boundary of each ITEM tidal interval (i.e. each ten percent of the observed tidal range)
Assign contours with median and standard deviation tide heights of Landsat observations for each tidal interval
Generate continuous elevation data from median tide heights per contour using Triangulated Irregular Network interpolation
Clean and filter DEMs to remove noise, modelling artefacts and invalid elevation estimates
References
Bishop-Taylor, R., Sagar, S., Lymburner, L., & Beaman, R. J. (2019). Between the tides: Modelling the elevation of Australia’s exposed intertidal zone at continental scale. Estuarine, Coastal and Shelf Science, 223, 115–128. https://doi.org/10.1016/j.ecss.2019.03.006
Chen, L. C. (1998). Detection of shoreline changes for tideland areas using multi-temporal satellite images. International Journal of Remote Sensing, 19(17), 3383–3397. https://doi.org/10.1080/014311698214055
Chen, Y., Dong, J., Xiao, X., Zhang, M., Tian, B., Zhou, Y., Li, B., & Ma, Z. (2016). Land claim and loss of tidal flats in the Yangtze Estuary. Scientific Reports, 6(1), 24018. https://doi.org/10.1038/srep24018
Liu, Y., Li, M., Zhou, M., Yang, K., & Mao, L. (2013). Quantitative analysis of the waterline method for topographical mapping of tidal flats: A case study in the dongsha sandbank, china. Remote Sensing, 5(11), 6138–6158. https://doi.org/10.3390/rs5116138
Sagar, S., Phillips, C., Bala, B., Roberts, D., & Lymburner, L. (2018). Generating continental scale pixel-based surface reflectance composites in coastal regions with the use of a multi-resolution tidal model. Remote Sensing, 10(3), 480. https://doi.org/10.3390/rs10030480
Sagar, S., Roberts, D., Bala, B., & Lymburner, L. (2017). Extracting the intertidal extent and topography of the Australian coastline from a 28 year time series of Landsat observations. Remote Sensing of Environment, 195, 153–169. https://doi.org/10.1016/j.rse.2017.04.009
Solihuddin, T., O’Leary, M. J., Blakeway, D., Parnum, I., Kordi, M., & Collins, L. B. (2016). Holocene reef evolution in a macrotidal setting: Buccaneer Archipelago, Kimberley Bioregion, Northwest Australia. Coral Reefs, 35(3), 783–794. https://doi.org/10.1007/s00338-016-1424-1
Zhao, B., Guo, H., Yan, Y., Wang, Q., & Li, B. (2008). A simple waterline approach for tidelands using multi-temporal satellite images: A case study in the Yangtze Delta. Estuarine, Coastal and Shelf Science, 77(1), 134–142. https://doi.org/10.1016/j.ecss.2007.09.022
Accuracy
To assess the accuracy of NIDEM, we compared modelled elevations against three independent elevation and bathymetry validation datasets: the DEM of Australia derived from LiDAR 5 Metre Grid (Geoscience Australia, 2015), elevation data collected from Real Time Kinematic (RTK) GPS surveys (Danaher & Collett, 2006; HydroSurvey Australia, 2009), and 1.0 m resolution multibeam bathymetry surveys (Solihuddin et al., 2016).
We assessed overall accuracy across three distinct intertidal environments: sandy beaches and shores, tidal flats, and rocky shores and reefs
Intertidal environment |
Number of sites |
Pearson’s correlation |
Spearman’s correlation |
RMSE +/- |
|---|---|---|---|---|
Sandy beaches and shores |
5 |
0.92 |
0.93 |
0.41 m |
Tidal flats |
9 |
0.78 |
0.81 |
0.39 m |
Rocky shores and reefs |
7 |
0.46 |
0.79 |
2.98 m |
Limitations
NIDEM covers the exposed intertidal zone which includes sandy beaches and shores, tidal flats and rocky shores and reefs. The model excludes intertidal vegetation communities such as mangroves.
Areas with comparatively steep coastlines and small tidal ranges are poorly captured in the 25 m spatial resolution input Landsat data and resulting NIDEM model. This includes much of the south eastern and southern Australian coast (e.g. New South Wales, Victoria, Tasmania).
Poor validation results for rocky shore and reef sites within the southern Kimberly region highlighted limitations in the NIDEM model that occur when the global OTPS TPX08 Atlas Tidal Model was unable to predict complex and asynchronous local tidal patterns. This is likely to also reduce model accuracy in complex estuaries and coastal wetlands where river flow or vegetative resistance causes hydrodynamic attenuation in tidal flow.
The complex temporal behaviour of tides mean that a sun synchronous sensor like Landsat does not observe the full range of the tidal cycle at all locations. This causes spatial bias in the proportion of the tidal range observed in different regions, which can prevent NIDEM from providing elevation data for areas of the intertidal zone exposed or inundated at the extremes of the tidal range. Accordingly, NIDEM provides elevation data for the portion of the tidal range observed by Landsat, rather than the full tidal range.
While image compositing and masking methods have been applied to remove the majority of noise and non-tidal artefacts from NIDEM, issues remain in several locations. It is recommended that the data be used with caution in the following areas:
The Recherche Archipelago in southern Western Australia
Port Phillip Bay in Victoria
The eastern coast of Tasmania and King Island
Saunders Reef and surrounds in the northern Coral Sea
Access the data
See it on a map |
Learn how to use DEA Maps |
|
Explore data availability |
Learn how to use the DEA Explorer |
|
Get the data online |
Learn how to access the data via AWS |
|
Get via web service |
Learn how to use DEA’s web services |
How to view the data in a web map
To view and access the data interactively:
Visit DEA Maps.
Click
Explore map data.Select
Sea, ocean and coast>Other>DEA Intertidal Elevation (Landsat).Click
Add to the map, or the+symbol to add the data to the map.
Other versions
You can find the history in the latest version of the product.
Acknowledgments
We thank the individuals and organisations that provided validation data for this study.
RTK GPS data used in Darwin Harbour, NT was provided by HydroSurvey Australia, with the permission of GHD and Power & Water Corporation, NT.
RTK GPS data used in Moreton Bay, QLD was provided by Tim Danaher, NSW Office of Environment and Heritage.
Multibeam bathymetry data over the Kimberley reefs was provided by M. O’Leary at Curtin University, WA.
We thank C. Burton, S. Chua, A. Haiblen, A. Lem, B. Moushall, B. Stepin and S. Wong for assisting with field validation.
This research was undertaken with the assistance of resources from the National Computational Infrastructure (NCI), which is supported by the Australian Government.
License and copyright
© Commonwealth of Australia (Geoscience Australia).
Released under Creative Commons Attribution 4.0 International Licence.