2.0.0: DEA Surface Reflectance Geomedian (Landsat)
2.0.0: DEA Surface Reflectance Geomedian (Landsat)
Surface Reflectance 25m Geomedian 2.0.0
- Version:
2.0.0 (See latest version)
- Product types:
Derivative, Raster
- Update frequency:
Deprecated
Old version
This is an old version of the product. See the latest version.
Key details
Collection |
Geoscience Australia Landsat Collection 2 |
Persistent ID |
|
Licence |
Publications
Roberts, D., Mueller, N., & Mcintyre, A. (2017). High-dimensional pixel composites from earth observation time series. IEEE Transactions on Geoscience and Remote Sensing, 55(11), 6254–6264. https://doi.org/10.1109/TGRS.2017.2723896
Background
When deriving information from satellite images it is often valuable to see how an area usually looks rather than how it was viewed at a single point in time.
When working with single time point images, there can be intermittent changes which aren’t representative of a ‘normal’ state for that area. These changes can occur due to natural variations in the landscape (browning of grass in winter, floods), land management practices (harvesting, tilling) or lack of visibility (clouds, smoke).
What this product offers
The surface reflectance geomedian product provides an average cloud-free image over the given time period. The geomedian image is calculated with a multi-dimensional median, using all the spectral measurements from the satellite imagery at the same time in order to maintain the relationships among the measurements.
As of version 2.0.0, the geometric median products are available as annual datasets, each created from one calendar year of earth observation data from a single satellite.
Applications
Land cover mapping
Change detection and classification
Technical information
Large-scale image composites are increasingly important for a variety of applications such as land cover mapping, change detection, and the generation of high-quality data to parameterise and validate bio-physical and geophysical models. A number of compositing methodologies are being used in remote sensing in general; however, challenges such as maintaining the spectral relationship between bands, mitigating against boundary artifacts due to mosaicking scenes from different epochs, and ensuring spatial regularity across the mosaic image still exist.
The creation of good composite images is a particularly important technology since the opening of the Landsat archive by the United States Geological Survey. The greater availability of satellite imagery has resulted in demand to provide large regional mosaics that are representative of conditions over specific time periods while also being free of clouds and other unwanted image noise. One approach is the stitching together of a number of clear images. Another is the creation of mosaics where pixels from different epochs are combined based on some algorithm from a time series of observations. This ‘pixel composite’ approach to mosaic generation provides a more consistent result compared with stitching clear images due to the improved color balance created by the combining of one-by-one pixel representative images. Another strength of pixel-based composites is their ability to be automated for application to very large data collections and time series such as national satellite data archives.
The geomedian provides an approach that leverages high-dimensional statistical theory to deliver a spectrally consistent, artefact-free pixel composite product.
The surface reflectance geometric median (geomedian) is a pixel composite mosaic of a time series of earth observations. Essentially the value of a pixel in a geomedian image is the statistical median of all observations for that pixel from a period of time. For example the 2016 Landsat 8 geomedian image over an area will be the median of Landsat 8 pixels observed for that area in 2016.
An annual geometric median is a high-dimensional median calculated from the reflectance values drawn from a calendar year. The years available are each full calendar year since 1988. The annual geometric medians of surface reflectance measurements are calculated per calendar year, on individual sensors (ie. only Landsat 5 TM or Landsat 7 ETM+ or Landsat 8 OLI).
Multispectral satellite imagery, such as is available from Landsat and Sentinel-2, consists of multiple measurements per pixel: one for each spectral band. In order to create a meaningful median, a median pixel must take all concurrent spectral measurements into account simultaneously as a multi-dimensional set, rather than each measurement independently as occurs with a simple median. The geomedian is a high-dimensional statistic, which calculates a multi-dimensional median from all the spectral measurements from the satellite imagery at the same time, and maintains the relationships among the measurements. This provides a median of the physical conditions measured by the earth observations used to create it, and provides a good representation of a typical pixel observation devoid of outliers, and exhibits reduced spatial noise.
The annual geomedian provides an annual surface reflectance composite for any area of interest within the area covered by the DEA data cube, up to the entire spatial extent available (continental). It provides a cloud-free overview of the middle surface reflectance value for each year and as it is equivariant (ie a linear algorithm applied to a geomedian image is equal to a geomedian applied to a set of images on which the same linear algorithm was applied) can be used in further analyses such as Tasseled Cap, Principal Components Analysis and Normalised Difference Indices. It is useful in analyses requiring baseline conditions such as change detection.
Surface reflectance geometric median products are derived from the Surface Reflectance (SR) products such as SR-N_25_2.0.0 and SR-NT_25_2.0.0, and provide statistical summaries of SR over specified periods (epochs). The geometric median (geomedian) provides a high dimensional median value (the median of a multi-dimensional dataset rather than the basic median) of earth observations for a specified epoch, and as such gives a representation of the middle of surface reflectance over the time period. This is a synthetic representation of a time series rather than an actual observed pixel. A benefit of the geomedian is that is statistically robust, and may be used for further analyses.
The geomedian (Roberts et al 2017) is used in preference to the mean, as the mean can be adversely effected by extrema whereas the median is less sensitive to outliers. The geomedian is used in preference to the basic median, as it preserves the physical relationship between spectral measurements which the basic median does not. The geometric median is used in preference to the medoid (Flood 2013) where a low noise composite is required. Where the provenance of each pixel in a composite is required the medoid is the preferred method and the geomedian should not be used.
The input data used to calculate the geomedian are filtered to remove poor quality observations including cloud, cloud shadow, band saturation (of any band) using the Pixel Quality Assessment (PQA) product. To account for satellite availability and status the statistics are calculated using the following satellites/sensors for the following periods of time:
1988–1999 |
Landsat 5 |
2000–2003 |
Landsat 7 |
2004–2007 |
Landsat 5 and Landsat 7 (as separate geomedian products) |
2008 |
Landsat 7 |
2009–2011 |
Landsat 5 and Landsat 7 (as separate geomedian products) |
2012 |
Landsat 7 |
2013 onward |
Landsat 7 and Landsat 8 (as separate geomedian products) |
The geomedian is a synthetic value as opposed to an actual observation, and is the high dimensional median of all reflectance bands of the source dataset for each year. A pixel composite mosaic created by producing images of geomedian pixels provides a representation of the median condition of the the earth for the area of observation for the time period over which the median was computed.
An advantage of the geomedian over other pixel compositing techniques is that the geomedian is a robust statistical measure, enabling further analyses to be undertaken. It is equivariant under linear transforms, and hence a suitable product for principal components analyses, Kauth-Thomas Transforms and other linear analyses common to remote sensing investigations.
The primary uses of geomedian pixel composites are for baselines for change detection, and for broad regional image composites (such as national and continental mosaics).
Lineage
The geomedian is derived from Landsat NBAR surface reflectance data (eg SR-N_25_2.0.0 or SR-NT_25_2.0.0), and hence consists of surface reflectance data. The data are masked for cloud, shadows and other image artefacts using the pixel quality product (PQ_25_2.0.0) to help provide as clear a set of observations as possible from which to calculate the geomedian. The algorithm used to create the geomedian composites is given in Roberts et al (2017).
Note: the constituent pixels in the geomedian pixel composite mosaics are synthetic, meaning that the pixels have not been physically observed by the satellite. Rather they are the computed high-dimensional median of a time series of pixels.
Processing steps
Calculate sun and sensor angles per pixel (Vincenty, 1975; Edberg and Oliver, 2013)
Determine values for six base atmospheric parameters across each image scene
Derive normalised surface reflectance for sun angle of 45°
Ortho-processing using DSM
Mask tile observations for pixel quality
Geometric Median
References
Roberts, D., Mueller, N., & Mcintyre, A. (2017). High-dimensional pixel composites from earth observation time series. IEEE Transactions on Geoscience and Remote Sensing, 55(11), 6254–6264. https://doi.org/10.1109/TGRS.2017.2723896
Accuracy
The accuracy of the geomedian is dependent on the accuracy of the underpinning earth observation data. As the values of the geomedian are synthetic (not observed directly by satellite), they cannot be verified by field work.
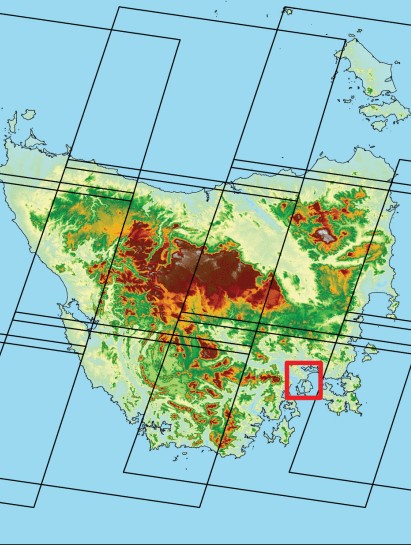
To calculate a geomedian representative of clear observations, the majority of the input data must be clear of clouds, shadows or other issues that can adversely affect an observation. Where a location experiences more than 50% of time under the impact of clouds and shadows (such as areas of Tasmania) the geomedian can produce an output that is essentially cloud / shadow noise. As such it is necessary to use a large enough collection of data to enable a clear median to be calculated. To mitigate the impact of poor quality observations and other artefacts, the input data is first screened using the Pixel Quality product (PQ_25_2.0.0), however some poor pixels are likely to still be included in the data after screening. Increasing the period from which observations are included in the input dataset also helps to mitigate the issue. Where no-data pixels occur in locations that clear observations should occur, the cause is a lack of clear pixels to populate the geometric median.
Other versions
You can find the history in the latest version of the product.
Acknowledgments
The high-dimensional statistics algorithms incorporated in this product is the work of Dr Dale Roberts, Australian National University.
License and copyright
© Commonwealth of Australia (Geoscience Australia).
Released under Creative Commons Attribution 4.0 International Licence.