2.1.5: DEA Water Observations Filtered Statistics (Landsat)
2.1.5: DEA Water Observations Filtered Statistics (Landsat)
Water Observations from Space Filtered Statistics 25m 2.1.5
- Version:
2.1.5 (See latest version)
- Product types:
Derivative, Raster
- Update frequency:
Deprecated
Old version
This is an old version of the product. See the latest version.
Key details
Collection |
Geoscience Australia Landsat Collection 2 |
Licence |
Publications
Mueller, N., Lewis, A., Roberts, D., Ring, S., Melrose, R., Sixsmith, J., Lymburner, L., McIntyre, A., Tan, P., Curnow, S., & Ip, A. (2016). Water observations from space: Mapping surface water from 25 years of Landsat imagery across Australia. Remote Sensing of Environment, 174, 341–352. https://doi.org/10.1016/j.rse.2015.11.003
Background
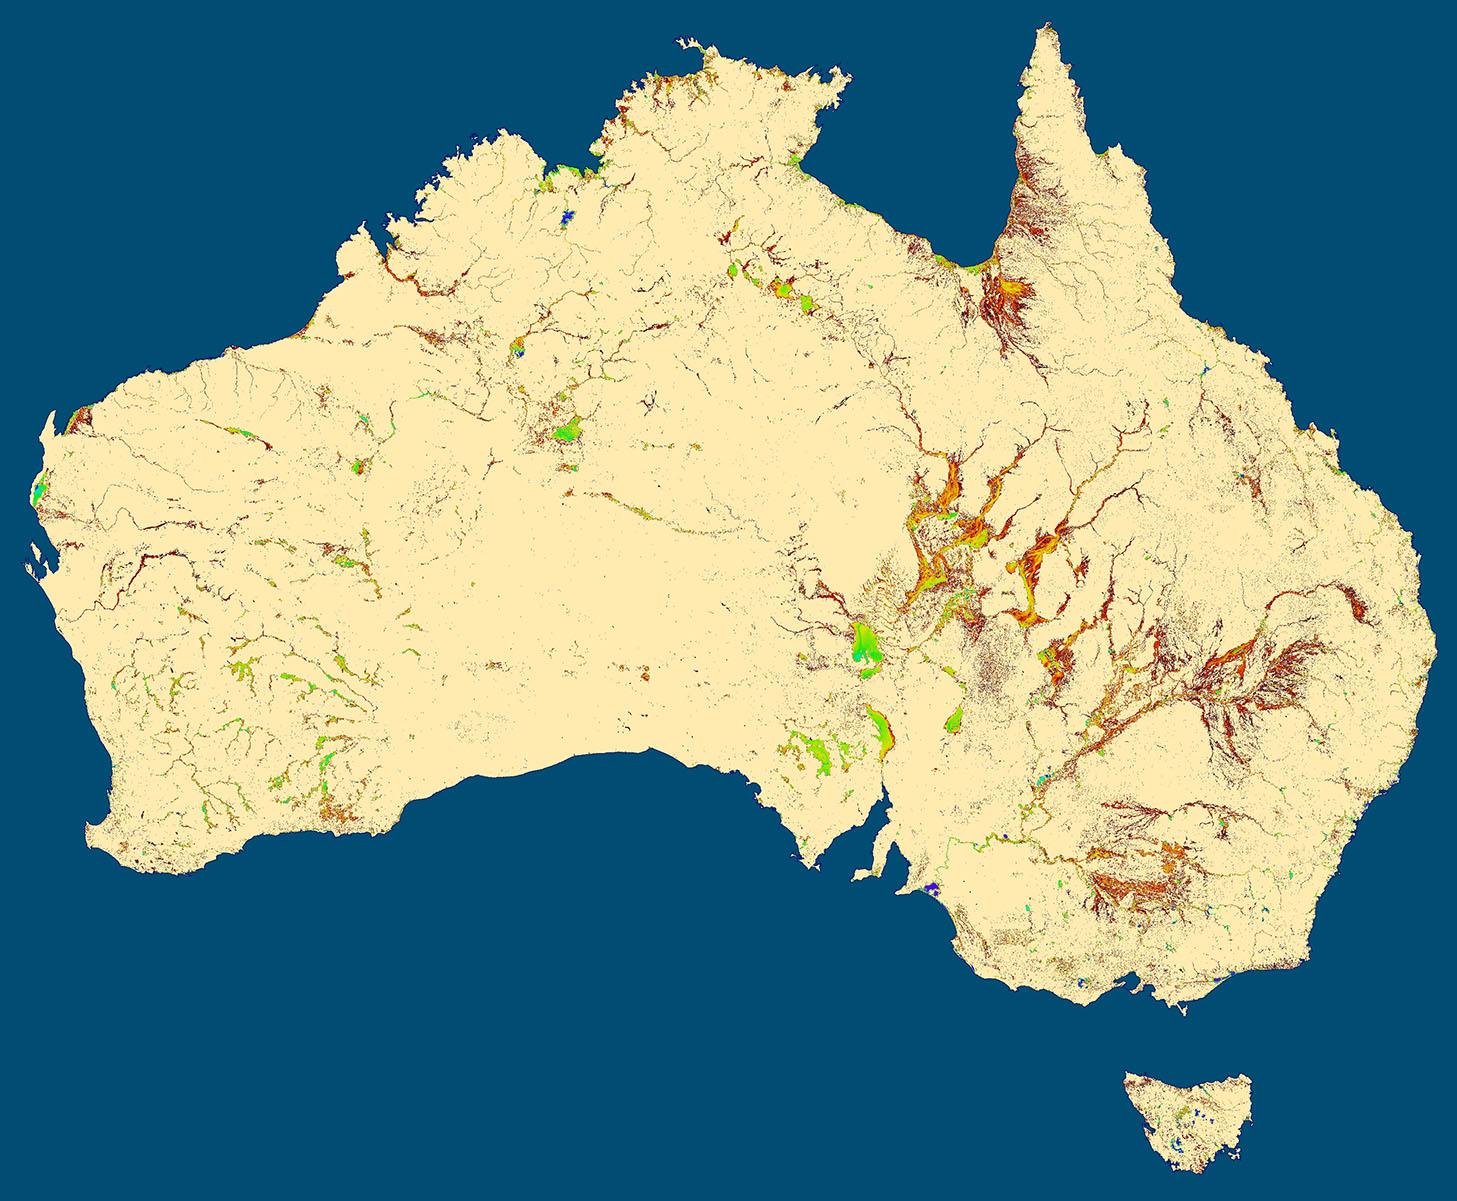
The Water Observations from Space Filtered Statistics (WO-FILT-STATS) is the ‘cleaned’ version of the WOfS Statistics product (WO-STATS).
WO-STATS takes the full, ongoing archive of all Water Observation Feature Layers (WOFLs) and combines them into a single product summary showing how often surface water was observed by the Landsat satellites from 1986 to the present.
WO-FILT-STATS goes further, comparing WO_STATS with other national surface water datasets to understand how confident we are that the water shown in WO-STATS is consistent with the long term understanding of water in the Australian landscape. Those areas where WO-STATS is not consistent with the other national datasets are then filtered out, to reduce misclassification from clouds, shadows and satellite errors.
What this product offers
WO-FILT-STATS consists of:
A Confidence layer that compares the WO-STATS water summary to other national water datasets.
A Filtered Water Summary which uses the Confidence to mask areas of the WO-STATS water summary where Confidence is low. The Filtered Water Summary provides the long term understanding of the recurrence of water in the landscape, with much of the noise due to misclassification filtered out. Even though confidence filtering is applied to the Filtered Water Summary, some cloud and shadow, and sensor noise does persist.
Applications
Helps understand where flooding may have occurred in the past, to inform emergency management and risk assessment.
Provides an indication of the permanence of surface water in the Australian landscape by showing where water is observed rarely in comparison to where it is often observed, informing water management and mapping.
Can assist with wetland analyses, water connectivity and surface-ground water relationships.
Technical information
WO-FILT-STATS consists of the following datasets:
Confidence: the degree of agreement between water shown in the Water Summary and other national datasets. The Confidence layer provides understanding of whether the water shown in the Water Summary agrees with where water should exist in the landscape, such as due to sloping land or whether water has been detected in a location by other means.
Filtered Water Summary: A simplified version of the Water Summary, showing the frequency of water observations where the Confidence is above a cutoff level. This layer gives a noise-reduced view of surface water across Australia. It provides the long term understanding of the recurrence of water in the landscape, with much of the noise due to misclassification filtered out.
Both layers are represented as 32-bit float.
Even though confidence filtering is applied to the Filtered Water Summary, some cloud and shadow, and sensor noise does persist.
In previous versions of WOfS, the basic water classifications, statistical summaries and confidence products were contained within one product with several datasets. As of version 2.1.5, WOfS is split into three products: Water Observation Feature Layers (WO_25_2.1.5), Summary Statistics (WO-STATS_25_2.1.5), and Filtered Summary Statistics (WO-Fil-STATS_25_2.1.5).
Lineage
The WOfS product is a key component of the National Flood Risk Information Portal (NFRIP), developed by GA. The objective of Water Observations from Space is to analyse GA’s historic archive of satellite imagery to derive water observations, to help understand where flooding may have occurred in the past. The collection of many hundred thousand WOFLs that make up WOfS are too cumbersome to display easily. WO_STATS provides the mechanism to present and deliver WOfS in a more easily digestible form, and provides understanding of water in the landscape. WO-FILT-STATS provides extra information to give a confidence in whether water is likely in the locations shown by the other WOfS products and provides a final, “cleaned” summary of water over time.
WO-FILT-STATS is created from the WOfS-STATS statistics (Water Observations Statistics 2 (Landsat)) derived from water classification (Water Observations 2 (Landsat)).
Reviews of prototype products identified the need to indicate the level of confidence for the surface water observations. The confidence level will help the user to distinguish between unusual but valid water detections (such as flood plains which might only be observed as water once in the 15 year interval) and false positives which can be caused, for instance, by steep shady slopes. The confidence level was determined through a multiple logistic regression of water observations against several factors that would either support or contradict the finding of water being present at the site. The factors comprise:
MrVBF, a multi-resolution valley bottom flatness product (Gallant et al., 2012) derived from Shuttle RADAR Topographic Mission (SRTM) data as part of the Terrestrial Ecosystems Research Network (TERN). Surface water pixels identified in valley bottoms were more likely to be positively detected.
Slope derived from SRTM Digital Surface Models. Water pixels on a slope were considered less plausible than those on a flat surface.
MODIS Open Water Likelihood (OWL) (Ticehurst et al, 2010) provides a plausibility based an independent water detection algorithm employing the MODIS sensor. If both detection algorithms agree on the presence of a surface water pixel, there is a greater plausibility that the detection is correct.
Observation Frequency (P), the number of observations of water as a fraction of the number of clear observations of the target pixel. P is high for more permanent water bodies.
Built-Up areas indicating areas of dense urban development. In such areas the water detection algorithm struggles to cope with the deep shadows cast by multi-story buildings and the generally noisy spectral response created by structures. The Built-Up layer is derived from the Australian Bureau of Statistics ASGS 2011 dataset, for urban centres of populations of 100 000 and over.
Once calculated the Confidence is used to filter the Water Summary from WO-STATS where confidence is <10% to create the Filtered Water Summary.
Processing steps
WOfS Confidence calculation
WOfS Summary Filtering
Accuracy
Please refer to the SR-N_25_2.0.0 Product Description (GA, 2013) for the accuracy and limitations of the atmospheric, BRDF and topographic shading processing sequence. Please refer to Mueller et al. 2016 for details on the accuracy and limitations of WOfS, WOfS-STATS and WOfS-FILT-STATS.
WO-FILT-STATS provides a filtered summary of water classification results from the WOfS product for all of Australia. As WOfS cannot perfectly filter out misclassifications due to clouds, cloud shadows and issues to do with satellite sensor problems (such as the Landsat 7 SLC-Off failure), the summary also contains these misclassifications. In general misclassifications occur in the very low frequency observations and so can cause a misrepresentation of flooded areas. The confidence filtering process in WO-FILT-STATS reduces the noise displayed in the Water Summary, making it easier to understand for the general user.
Quality assurance
The quality of WOfS-FILTERED-STATS is verified by visual inspection, to find instances of processing failure or issues relating to upstream data quality issues. Any detected issues are related to the DEA Pipeline and Core teams for checking and rectification.
Other versions
You can find the history in the latest version of the product.
Acknowledgments
The logistic regression algorithm was adapted for the WOfS product by Dr Dale Roberts of the Australian National University.
License and copyright
© Commonwealth of Australia (Geoscience Australia).
Released under Creative Commons Attribution 4.0 International Licence.