2.1.5: DEA Water Observations Statistics (Landsat)
2.1.5: DEA Water Observations Statistics (Landsat)
Water Observations from Space Statistics 25m 2.1.5
- Version:
2.1.5 (See latest version)
- Product types:
Derivative, Raster
- Update frequency:
None
- Product IDs:
wofs_summary, wofs_annual_summary, wofs_apr_oct_summary, wofs_nov_mar_summary
Old version
This is an old version of the product. See the latest version.
Key details
Collection |
Geoscience Australia Landsat Collection 2 |
Persistent ID |
|
Licence |
Publications
Mueller, N., Lewis, A., Roberts, D., Ring, S., Melrose, R., Sixsmith, J., Lymburner, L., McIntyre, A., Tan, P., Curnow, S., & Ip, A. (2016). Water observations from space: Mapping surface water from 25 years of Landsat imagery across Australia. Remote Sensing of Environment, 174, 341–352. https://doi.org/10.1016/j.rse.2015.11.003
Background
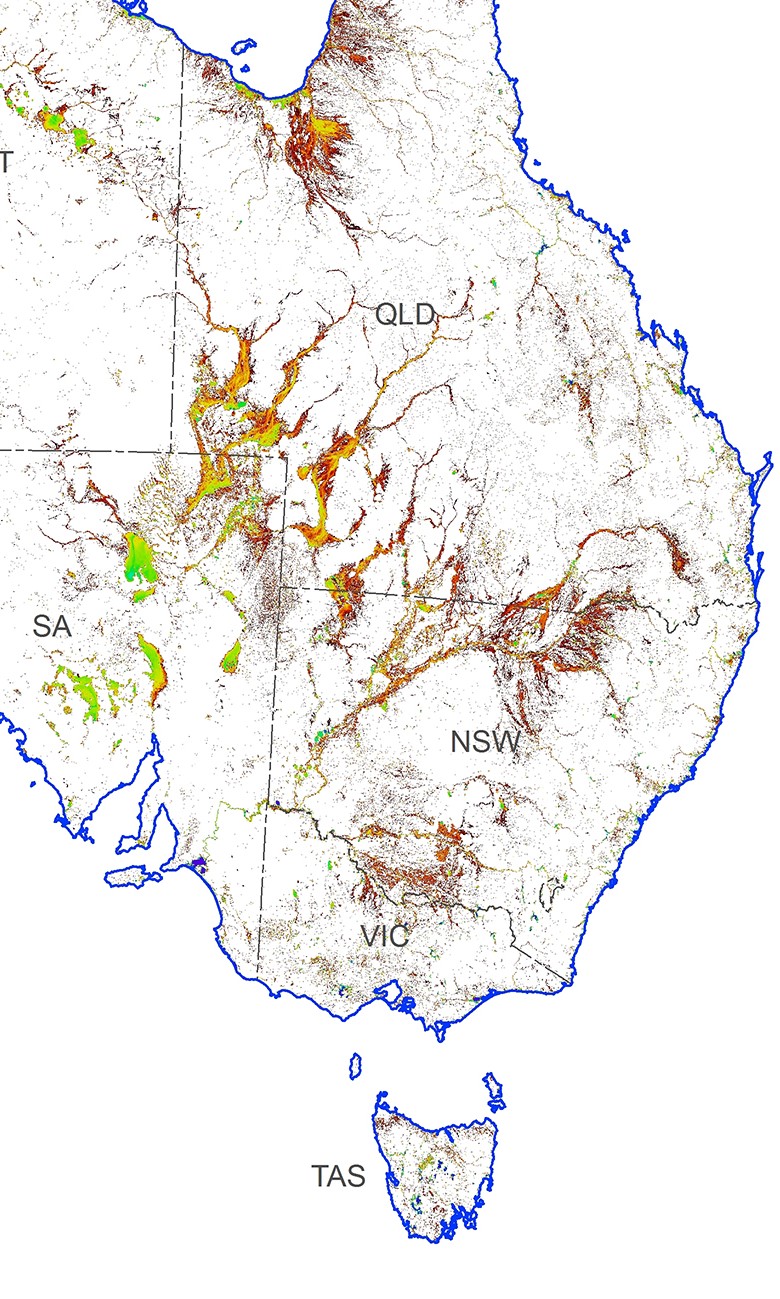
This is one of the Water Observations from Space suite of products, which gives summaries of how often surface water was observed by the Landsat satellites for various periods (per year, per season and for the period from 1986 to the present).
WO-STATS is created from the WO_25_2.1.5 product and provides information on how many times the Landsat satellites were able to clearly see an area, how many times those observations were wet, and what that means for the percentage of time that water was observed in the landscape.
What this product offers
This product consists of the following datasets:
Clear Count: how many times an area could be clearly seen (ie. not affected by clouds, shadows or other satellite observation problems)
Wet Count: how many times water was detected in observations that were clear
Water Summary: what percentage of clear observations were detected as wet (ie. the ration of wet to clear as a percentage)
As no confidence filtering is applied to this product, it is affected by noise where misclassifications have occurred in the WOfS water classifications, and can be difficult to interpret on its own. The confidence layer and filtered summary are contained in the WO-FILT-STATS product, which provides a noise-reduced view of the water summary.
WO-STATS is available in multiple forms, depending on the length of time over which the statistics are calculated. At present the following are available:
WO-STATS: statistics calculated from the full depth of time series (1986 to present)
WO-STATS-ANNUAL: statistics calculated from each calendar year (1986 to present)
WO-STATS-NOV-MAR: statistics calculated yearly from November to March (1986 to present)
WO-STATS-APR-OCT: statistics calculated yearly from April to October (1986 to present)
Applications
Helps understand where flooding may have occurred in the past, to inform emergency management and risk assessment.
Provides an indication of the permanence of surface water in the Australian landscape by showing where water is observed rarely in comparison to where it is often observed, informing water management and mapping.
Can assist with wetland analyses, water connectivity and surface-ground water relationships.
The annual product provides information on how surface water changes per year across Australia, and is useful for drought analysis.
The seasonal product is useful for understanding the differences in water availability between the summer and winter periods across Australia.
Technical information
As no confidence filtering is applied to this product, it is affected by noise where misclassifications have occurred in the WOfS water classifications, and hence can be difficult to interpret on its own. The confidence layer and filtered summary are contained in the WO-Fil-STATS product, which provide a noise-reduced view of the water summary.
WO-STATS is available in multiple forms, depending on the length of time over which the statistics are calculated. At present the following are available:
WO-STATS: statistics calculated from the full depth of time series (1986 to present)
WO-STATS-ANNUAL: statistics calculated from each calendar year (1986 to present)
WO-STATS-NOV-MAR: statistics calculated yearly from November to March (1986 to present)
WO-STATS-APR-OCT: statistics calculated yearly from April to October (1986 to present)
In previous versions of WOfS, the basic water classifications, statistical summaries and confidence products were contained within one product with several datasets. As of version 2.1.5, WOfS is split into three products: Water Observation Feature Layers (WO_25_2.1.5), Summary Statistics (WO-STATS_25_2.1.5), and Filtered Summary Statistics (WO-Fil-STATS_25_2.1.5).
Lineage
This product is created from the WOfS water classification (Water Observations 2 (Landsat)). Every pixel location in WO_25_2.1.5 is analysed statistically to derive the count of clear observations, the count of clear-wet observations and then calculate the percentage of clear observations that were also wet. This provides a ‘normalised’ water frequency product for all of Australia.
Processing steps
Water Observation from Space (WOfS) - statistics
References
Mueller, N., Lewis, A., Roberts, D., Ring, S., Melrose, R., Sixsmith, J., Lymburner, L., McIntyre, A., Tan, P., Curnow, S., & Ip, A. (2016). Water observations from space: Mapping surface water from 25 years of Landsat imagery across Australia. Remote Sensing of Environment, 174, 341–352. https://doi.org/10.1016/j.rse.2015.11.003
Accuracy
Please refer to the SR-N_25_2.0.0 Product Description (GA, 2013) for the accuracy and limitations of the atmospheric, BRDF and topographic shading processing sequence. Please refer to Mueller et al. 2016 for details on the accuracy and limitations of WOfS and WOfS-STATS.
WO-STATS provides a summary of water classification results from the WOfS product for all of Australia. As WOfS cannot perfectly filter out misclassifications due to clouds, cloud shadows and issues to do with satellite sensor problems (such as the Landsat 7 SLC-Off failure), the summary also contains these misclassifications. In general misclassifications occur in the very low frequency observations and so can cause a misrepresentation of flooded areas. Misclassifications can also be caused by the presence of vegetation covering the water or within the water.
Other versions
You can find the history in the latest version of the product.
License and copyright
© Commonwealth of Australia (Geoscience Australia).
Released under Creative Commons Attribution 4.0 International Licence.