1.0.0: DEA Waterbodies (Landsat)
1.0.0: DEA Waterbodies (Landsat)
Digital Earth Australia Waterbodies
- Version:
1.0.0 (See latest version)
- Product types:
Derivative, Raster
- Update frequency:
None
Old version
This is an old version of the product. See the latest version.
Key details
Collection |
Geoscience Australia Landsat Collection 2 |
Licence |
Publications
Krause, Claire E.; Newey, Vanessa; Alger, Matthew J.; Lymburner, Leo. 2021. “Mapping and Monitoring the Multi-Decadal Dynamics of Australia’s Open Waterbodies Using Landsat” Remote Sens. 13, no. 8: 1437. https://doi.org/10.3390/rs13081437
Mueller, N., Lewis, A., Roberts, D., Ring, S., Melrose, R., Sixsmith, J., Lymburner, L., McIntyre, A., Tan, P., Curnow, S., & Ip, A. (2016). Water observations from space: Mapping surface water from 25 years of Landsat imagery across Australia. Remote Sensing of Environment, 174, 341–352. https://doi.org/10.1016/j.rse.2015.11.003
Background
It is important to have up-to-date information about the extent and location of surface water in Australia. It provides us with a common understanding of this valuable and increasingly scarce resource.
What this product offers
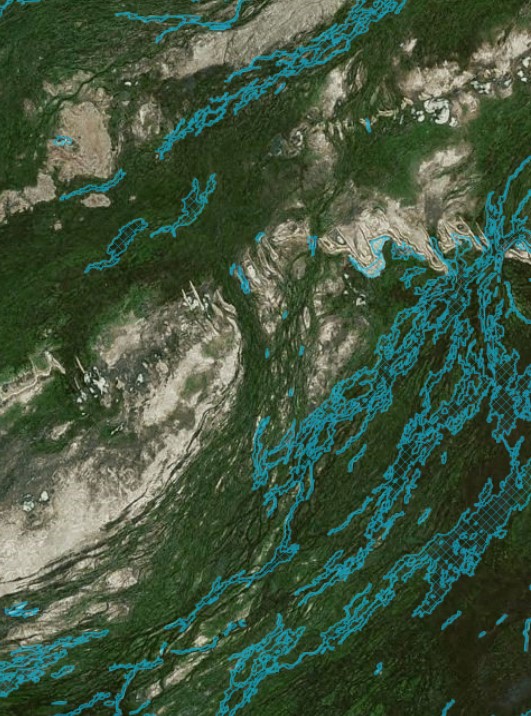
Digital Earth Australia Waterbodies uses Geoscience Australia’s archive of over 30 years of Landsat satellite imagery to identify where almost 300,000 waterbodies are in the Australian landscape and tells us the wet surface area within those waterbodies.
The tool uses a water classification for every available Landsat satellite image and maps the locations of waterbodies across Australia. It provides a time series of wet surface area for waterbodies that are present more than 10% of the time and are larger than 3125m2 (5 Landsat pixels).
The tool indicates changes in the wet surface area of waterbodies. This can be used to identify when waterbodies are increasing or decreasing in wet surface area.
Disclaimer: This graph shows the wet surface area of waterbodies as estimated from satellites. It does not show depth, volume, purpose of the waterbody, nor the source of the water.
Applications
Understand and manage water across Australia
Gain insights into the severity and spatial distribution of drought
Identify potential water sources for aerial firefighting during bushfires
Technical information
Example - Kati Thanda–Lake Eyre, South Australia

This graph shows the change in the percentage of the total waterbody surface area observed as wet for Kati Thanda–Lake Eyre over time. The graphs are updated with the most recent satellite imagery on at least a monthly basis. The presence of cloud, and the revisit frequency of the satellites mean that it does not observe every waterbody every day.
Lineage
This product builds upon the Water Observations from Space dataset, details of which are available here: https://cmi.ga.gov.au/wo_25_2.1.5.
The code used in the development of this product is available on GitHub - GeoscienceAustralia/dea-waterbodies
References
Mueller, N., Lewis, A., Roberts, D., Ring, S., Melrose, R., Sixsmith, J., Lymburner, L., McIntyre, A., Tan, P., Curnow, S., & Ip, A. (2016). Water observations from space: Mapping surface water from 25 years of Landsat imagery across Australia. Remote Sensing of Environment, 174, 341–352. https://doi.org/10.1016/j.rse.2015.11.003
Accuracy
Many of the inaccuracies and limitations of the waterbody analysis are inherited from WOfS, with this product a reanalysis and mapping product built off the WOfS datasets. WOfS has a number of known limitations, and these manifest as misclassified waterbodies within this analysis. WOfS uses the spectral signature of water to classify wet pixels, and is known to be suboptimal in locations where water and vegetation are mixed. This includes locations such as rivers with vegetated riparian zones and vegetated wetlands. The effect of this can be seen by the discontinuity of narrower river features identified within this analysis, and an under representation of water within vegetated wetlands, such as the Macquarie Marshes, NSW.
Other known WOfS limitations have been limited through the filtering processes used to produce the map of waterbodies. Issues with mixed water and vegetation pixels around features like small farm dams have been avoided by limiting the size of mapped waterbodies to at least five Landsat pixels. Misclassification of water in deep shadows in high density cities has been handled by removing any waterbody polygons identified within CBDs. Intermittently misclassified features, which return valid results only a handful of times over the 32 year study period, are also filtered out by testing for the number of valid observations returned for each pixel.
Despite this, some errors remain in the final waterbodies dataset. Steep terrain shadows present a known difficulty for the WOfS classifier, due to the shadows produced. While WOfS has attempted to mitigate this issue, some misclassification remains. We have not specifically attempted to address these errors within this workflow, and as such, a negligible number of the identified waterbodies may in fact be artifacts caused by terrain shadow. The signal to noise ratio over deeper water has also not been addressed here, and may result in some pixels missing from the centre of deeper waterbodies, resulting in doughnut-shaped mapped polygons. Similarly, different water colours may interfere with the decision-tree classifier, resulting in very turbid or coloured waterbodies being misclassified.
The automatic cloud masking algorithm used in this analysis can misclassify bright, white sands seen on the bottom of some waterbodies as clouds. This issue is particularly problematic where these bright sands are only exposed when the waterbody begins to empty, resulting in the bright sands being seen inconsistently over time. It is very difficult to accurately cloud mask these sands, as they are seen in some scenes but not others, in the same way that clouds come and go between scenes. In this version of DEA Waterbodies, we have not addressed this issue, and note it as a limitation that results in short or missing timeseries; the sands are incorrectly classified as cloud, and the scene is thrown out as being unsuitable, resulting in very few ‘clear’ scenes. We hope to address this issue in the next release of the DEA Waterbodies product.
For a full discussion of the limitations and accuracy of WOfS, see Mueller et al. (2016).
Access the data
There are no data source links available at the present time.
How to access the data
DEA Maps
To view and access the data interactively:
Visit DEA Maps.
Click ‘Add data’.
Select ‘Surface water’ > ‘Digital Earth Australia Waterbodies’.
Select ‘Digital Earth Australia Waterbodies’ and click ‘Add to the map’.
Other versions
You can find the history in the latest version of the product.
Acknowledgments
This work was carried out in collaboration with NSW Department of Planning, Industry and Environment.
License and copyright
© Commonwealth of Australia (Geoscience Australia).
Released under Creative Commons Attribution 4.0 International Licence.