DEA Tasseled Cap Percentiles (Landsat)
DEA Tasseled Cap Percentiles (Landsat)
Geoscience Australia Tasseled Cap Percentiles Collection 3
- Version:
3.0.0 (Latest)
- Product types:
Derivative, Raster
- Time span:
1987 – 2022
- Update frequency:
Yearly
- Product IDs:
ga_ls_tc_pc_cyear_3, ga_ls_tc_pc_fyear_3
Provisional product
This is a provisional product, meaning it has not yet passed quality control and/or been finalised for release.
About
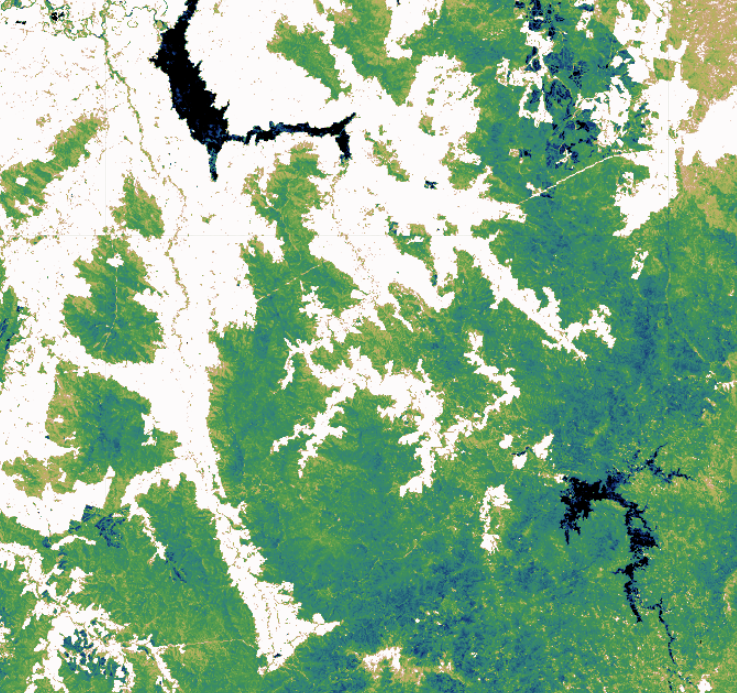
Tasseled Cap percentiles provide an annual summary of how the environment has varied through a year. The Tasseled Cap percentiles provide the upper, lower and middle conditions as described by the 90th, 10th and 50th percentiles respectively, of greeness, wetness and brightness across the landscape.
These percentiles are intended for use as inputs into classification algorithms to identify such environmental features as wetlands and groundwater dependent ecosystems, and characterise salt flats, clay pans, salt lakes and coastal land forms.
Access the data
For help accessing the data, see the Access tab.
Data explorer
DEA Tasseled Cap Calendar Year Percentiles
DEA Tasseled Cap Financial Year Percentiles
Web Services
Key details
Parent product(s) |
|
Collection |
Geoscience Australia Landsat Collection 3 |
Licence |
Cite this product
Data citation |
Geoscience Australia, 2023. DEA Tasseled Cap Percentiles (Landsat, Provisional). Geoscience Australia, Canberra.
|
Publications
Crist, E. P. (1985). A TM Tasseled Cap equivalent transformation for reflectance factor data. Remote Sensing of Environment, 17(3), 301–306. https://doi.org/10.1016/0034-4257(85)90102-6
Background
The Tasseled Cap (Kauth–Thomas) transformation takes satellite imagery and shows the degree of greeness, wetness and brightness across the observed area. These indexes help users understand the combinations of vegetation, water and bare areas respectively. As such the Tasseled Cap is a useful input into environmental analyses, especially where there are mixtures of all three features in the landscape, such as in wetlands.
What this product offers
This product offers three percentiles (10th, 50th and 90th) per Tasseled Cap index (greeness, wetness and brightness) per year, from 1987 to the present.
It is useful in broad environmental analyses where it is desirable to understand a mixed landscape including vegetation, water and bare areas, and as such is useful for wetlands analyses.
Data description
Tasseled Cap percentiles are created by bringing together all individual satellite images for a year and generating the corresponding Tasseled Cap for each, before computing the 10th, 50th and 90th percentiles of their respective data ranges. The percentiles are chosen to represent minimum, middle and maximum (or general) conditions for each index per year, for every 30m x 30m pixel across Australia.
Applications
This product provides valuable discrimination for characterising:
Vegetated wetlands
Salt flats
Salt lakes
Coastal land cover classes
Technical information
The Tasseled Cap (Kauth–Thomas) transform translates the six spectral bands of Landsat into a three indexes describing greeness, wetness and brightness. These indexes can be used to help understand complex ecosystems, such as wetlands or groundwater dependent ecosystems. The Tasseled Cap Percentiles capture how the greeness, wetness and brightness of the landscape behaves over time.
The percentiles are well suited to characterising wetlands, salt flats/salt lakes and coastal ecosystems. However, care should be applied when analysing these indexes, as soil colour and fire scars can cause misleading results. In areas of high relief caused by cliffs or steep terrain, terrain shadows can cause false positives.
The 10th, 50th and 90th percentiles of the Tasseled Cap are intended to capture the extreme (10th and 90th percentile) values and long-term average (50th percentile) values of each index. Percentiles are used in preference to minimum, maximum and mean, as the min/max/mean statistical measures are more sensitive to undetected cloud/cloud shadow, and can be misleading for non-normally distributed data.
The Tasseled Cap Percentiles are intended to complement the DEA Water Observations (Water Observations from Space) and Fractional Cover algorithms. DEA WO is designed to discriminate open water, but the Tasseled Cap wetness index identifies areas of water and areas where water and vegetation are mixed together; i.e. mangroves and palustrine wetlands. Similarly Fractional Cover describes proportions of green, brown and bare areas in the landscape, and hence the Fractional Cover percentiles can be used in complement to the Tasseled Cap percentiles.
However if you are interested in terrestrial vegetation (where water in the pixel is not a factor), use the Fractional Cover product in preference to the Tasseled Cap, which provides a better biophysical characterisation of green vegetation fraction, dry vegetation fraction and bare soil vegetation fraction.
We used the Tasseled Cap transforms described in Crist et al. (1985).
Lineage
The lineage of this product is inherited from its sole input, the terrain corrected surface reflectance product Surface Reflectance NBART Collection 3 (Landsat).
References
Crist, E. P. (1985). A TM Tasseled Cap equivalent transformation for reflectance factor data. Remote Sensing of Environment, 17(3), 301–306. https://doi.org/10.1016/0034-4257(85)90102-6
Accuracy
As an ‘index’ this does not have any ‘accuracy’ as distinct from the ‘accuracy’ of the input surface reflectance.
In terms of limitations, caution should be used, especially with the Tasseled Cap wetness index results in areas where residual terrain shadow, or dark soils can cause high ‘wetness’ index values.
One of the limitations of using the Tasseled Cap wetness index is that it will identify all ‘wet’ things, including potential wetlands, groundwater dependent ecosystems, irrigated crops/pasture, man-made water storages and sewerage treatment, and does not discriminate between these. As such it should be used in conjunction with other contextual data to ensure that features identified using the Tasseled Cap Wetness Percentiles are features of interest rather than false positives.
Access the data
Explore data availability |
Learn how to use the DEA Explorer |
|
Get the data online |
Learn how to access the data via AWS |
|
Get via web service |
Learn how to use DEA’s web services |
License and copyright
© Commonwealth of Australia (Geoscience Australia).
Released under Creative Commons Attribution 4.0 International Licence.