DEA Burnt Area Characteristic Layers Sentinel-2 Near Real-Time
DEA Burnt Area Characteristic Layers Sentinel-2 Near Real-Time
Geoscience Australia Burnt Area Characteristic Layers Sentinel-2 Near Real-Time
- Version:
1.0.0 (Latest)
- Product types:
Derivative, Raster
- Time span:
1 Jul 2021 – 29 Aug 2023
- Update frequency:
Daily
- Next update:
No updates planned
- Product ID:
ga_s2_ba_provisional_3
Provisional product
This is a provisional product, meaning it has not yet passed quality control and/or been finalised for release.
About
DEA Provisional Burnt Area Characteristic Layers contribute to the understanding of the distribution and frequency of fire in the Australian continent by measuring change in vegetation cover and soil characteristics that may be indicative of fire activity in the landscape.
Access the data
For help accessing the data, see the Access tab.
Data explorer
Access the data on AWS
Key details
Parent product(s) |
|
Collection |
Geoscience Australia Sentinel-2 Collection 3 |
DOI |
|
Licence |
Cite this product
Data citation |
Geoscience Australia, 2022. DEA Burnt Area Characteristic Layers (Sentinel 2 Near Real-Time, Provisional). Geoscience Australia, Canberra. https://dx.doi.org/10.26186/146449
|
Background
Bushfires pose a serious and increasing threat to Australia. The detection and mapping of burns has many applications to support management of areas impacted by fire. The identification of bushfire burn using Earth Observation is often manual, can come with a significant time delay, and only available at a relatively small scale. This product offers provisional and preliminary change detection using same day satellite data to automatically and rapidly identify burn characteristics.
Knowledge about the potential location and extent of fire helps to understand community and ecosystem impacts, enables directed relief and recovery support, and informs planning of mitigation burning for future fire seasons.
What this product offers
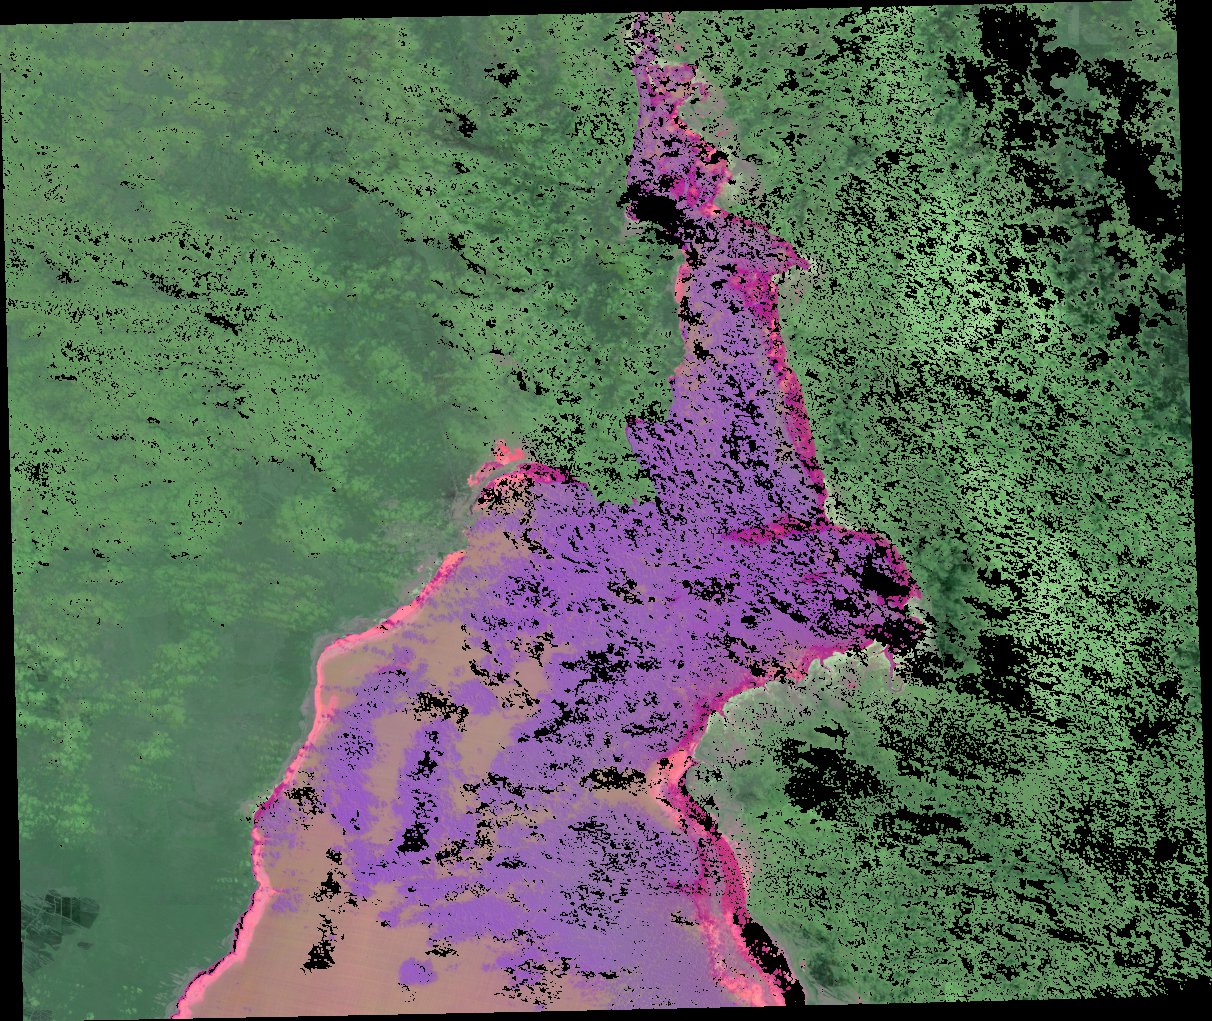
DEA Provisional Burnt Area Characteristic Layers contribute to the understanding of the distribution and frequency of fire in the Australian continent by measuring change in vegetation cover and soil characteristics that may be indicative of fire activity in the landscape. This product contains three layers that each describe change in a specific remote sensing index. Change in each index is measured between a baseline reference image and the most recent observation of Australia from the Sentinel-2 satellite constellation.
The indexes contained in each dataset describe change in a characteristic of the Earth’s surface that may be the result of a burn. The characteristic described are green vegetation cover and the reflective properties of bare soil and of burnt materials. These layers can be used to detect areas that may have been recently burnt, as fire will change the presence of these characteristics in the satellite data. These layers should be used with other information sources to determine if the change is the result of fire or other processes.
Applications
As a preliminary use-case to show the potential of near real-time change detection
As a screening tool to identify the potential location of new burnt areas
As a screening tool to identify the potential size of burnt areas
To visually identify potential changes of known burnt areas between two time periods
Technical information
This Near Real-Time (NRT) change detection product is based on:
a pre-fire reference baseline dataset (baseline_metric) - DEA Sentinel 2 Barest Earth (Roberts, et al. 2019).
the latest (NRT_metric) daily Sentinel-2 (A and B combined) Near Real-Time provisional satellite data.
The following metrics were calculated to identify burnt area characteristics:
Bare Soil Index (BSI)
Normalized Difference Vegetation Index (NDVI)
Normalized Burn Ratio (NBR)
This product contains delta (differenced) indexes for the three metrics above and how the NRT image has changed compared to a reference image. This means, the change metrics are not just describing what the satellite has analysed on a given day but how that day’s landscape has changed from a baseline. Delta indexes, sometimes called differenced indexes, are a useful tool in remote sensing for detecting and mapping environmental or manmade events that have an effect on land cover. This dataset contains three data layers; Delta Normalised Burn Ratio (\(\Delta\)NBR), Delta Bare Soil Index (\(\Delta\)BSI) and the Delta Normalised Difference Vegetation Index (\(\Delta\)NDVI).
The indexes in this dataset enhance specific characteristics of the Earth’s surface which change as a result of a fire. The delta layers show areas where these characteristics have increased or decreased between the baseline and new scenes. Each delta layer displays values between -1 and +1. Positive values indicate a change that may be indicative of a fire, for example loss of green vegetation or increased soil exposure. Negative values indicate a change that shouldn’t be caused by a fire, such as increased vegetation cover.
It should be noted, values that are further away from zero indicate a greater rate of change from the baseline state. A larger positive value does not necessarily indicate a greater confidence of burn being detected relative to a smaller positive value.
Baseline Imagery
The baseline image used is the Sentinel-2 ‘Barest Earth’ dataset; a cloud free mosaic generated from Sentinel-2 imagery using the methodology from Roberts et al. 2019 (exposed soil and mineral map of the Australian continent revealing the land at its barest). Using the Barest Earth image as a baseline has a number of advantages. By providing an already very dry baseline state it reduces the number of false positives in the dataset. Vegetation types with strong seasonal variation like grasslands and agricultural areas appear as relatively bare in the baseline image and so little change is visible when harvesting or seasonal drying occurs.
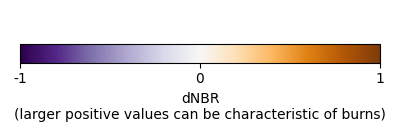
Delta Normalised Burn Ratio (\(\Delta\)NBR)
Normalized Burn Ratio (NBR), first published in Wagtendonk et al. (2004), identifies areas that have the characteristics of burnt vegetation. NBR looks at the relationship between near infrared (NIR) and short wave infrared (SWIR) spectral response. Burnt vegetation strongly absorbs light in NIR but not in SWIR. High SWIR reflectance values with low NIR reflectance values are indicative of an area that has been burnt by fire(s), while the opposite trend is seen in healthy vegetation.
NBR is calculated as:
The change (\(\Delta\)) in NBR is calculated as:
The delta NBR layer displays values between -1 and +1, with positive value being more indicative that an area has been burnt, colour bar provided below.
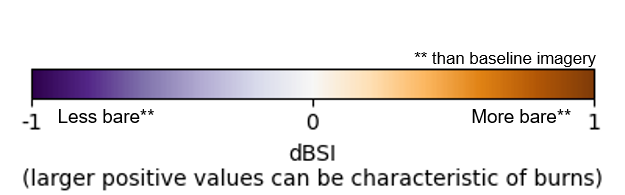
Delta Bare Soil Index (\(\Delta\)BSI)
The Bare Soil Index (BSI), first proposed in Rikimaru and Miyatake (2002), identifies soil or bare-land characteristics by combining blue, red, near infrared (NIR), and short wave infrared (SWIR) spectral bands. SWIR and red spectral bands can be used to identify basic soil mineralogy while blue and NIR spectral bands can help to detect vegetation. Fire generally increases the visibility of bare soil by reducing vegetation cover so burnt areas can be expected to have a high BSI signal.
The Bare Soil Index is calculated as:
The change (\(\Delta\)) in BSI is calculated as:
Delta BSI is multiplied by negative 1 in order to reverse the scaling so that it can be presented the same way as the other delta indexes, which all have positive values for areas that shows characteristics of being burnt. The \(\Delta\)BSI layer displays values between -1 and +1, with a positive value being more indicative that an area has increased exposure of bare soil. Colour bar provided, below.
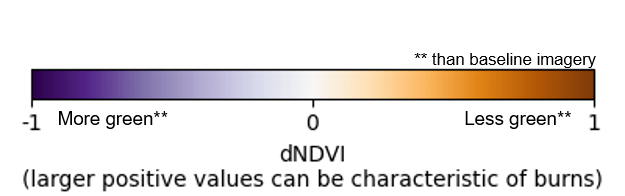
Delta Normalised Difference Vegetation Index (\(\Delta\)NDVI)
Normalized Difference Vegetation Index (NDVI), first published in Rouse et al. (1974), is used to detect green photosynthetic vegetation characteristics by identifying the difference between red/visible and near infrared (NIR) spectral bands. Fires generally decrease the presence of green vegetation.
NDVI is calculated as:
The change (\(\Delta\)) in NDVI is calculated as:
The \(\Delta\)NDVI layer displays values between -1 and +1, with positive values being more indicative that green vegetation in an area has decreased, and therefore showing the characteristics of being burnt.
Lineage
The DEA Burnt Area Characteristic Layers is a change detection product derived from two data sources:
DEA Sentinel-2 Barest Earth (based on method of Roberts, et al. 2019).
The daily Sentinel-2 (A and B combined) Near Real-Time provisional satellite data.
The Sentinel-2 (A and B combined) Near Real-Time data is masked for cloud, shadows and other image artefacts using the Sentinel-2 fmask pixel quality layer to help provide as clear a set of observations as possible for change detection.
The following indexes are calculated from both the DEA Sentinel 2 Barest Earth and the Sentinel-2 Near Real-Time data:
Bare Soil Index (BSI)
Normalized Difference Vegetation Index (NDVI)
Normalized Burn Ratio (NBR)
The change layers for each index are then calculated in the following way for each index:
References
Cocke A. E., Fulé P. Z., Crouse J. E. (2005) Comparison of burn severity assessments using Differenced Normalized Burn Ratio and ground data. International Journal of Wildland Fire 14, 189-198. https://doi.org/10.1071/WF04010
Dindaroglu, T., Babur, E., Yakupoglu, T., Rodrigo-Comino, J. and Cerdà, A., (2021) Evaluation of geomorphometric characteristics and soil properties after a wildfire using Sentinel-2 MSI imagery for future fire-safe forest. Fire Safety Journal 122. https://doi.org/10.1016/j.firesaf.2021.103318
Huete, A.R., Jackson, R.D., (1987) Suitability of spectral indices for evaluating vegetation characteristics on arid rangelands, Remote Sensing of Environment, 23( 2), 213, https://doi.org/10.1016/0034-4257(87)90038-1
Jin, S., Yang, L., Danielson, P., Homer, C., Fry, J. and Xian, G. (2013). A comprehensive change detection method for updating the National Land Cover Database to circa 2011. Remote Sensing of Environment 132. 159-175 https://doi.org/10.1016/j.rse.2013.01.012
Keeley, J. E. (2009). Fire intensity, fire severity and burn severity: A brief review and suggested usage. International Journal of Wildland Fire, 18(1), 116–126 https://doi.org/10.1071/WF07049
Rahman, S., Chang, H.C., Hehir, W., Magilli, C. and Tomkins, K., (2018) Inter-Comparison of Fire Severity Indices from Moderate (Modis) and Moderate-To-High Spatial Resolution (Landsat 8 & Sentinel-2A) Satellite Sensors. In IGARSS 2018-2018 IEEE International Geoscience and Remote Sensing Symposium 2873-2876 https://doi.org/10.1109/IGARSS.2018.8518449
Rikimaru, A., Roy, P.S. and Miyatake, S., (2002). Tropical forest cover density mapping. Tropical ecology, 43(1), 39-47. https://www.tropecol.com/pdf/open/PDF_43_1/43104.pdf
Roberts, D., Wilford, J. & Ghattas, O. (2019). Exposed soil and mineral map of the Australian continent revealing the land at its barest. Nature Communications 10, Article 5297. https://doi.org/10.1038/s41467-019-13276-1
Rouse, J.W., Haas, R.H., Schell, J.A. and Deering, D.W., (1974). Monitoring vegetation systems in the Great Plains with ERTS. NASA special publication, 351, 309
United Nations, Normalized Burn Ratio (NBR), Office for Outer Space Affairs UN-SPIDER Knowledge Portal. https://un-spider.org/advisory-support/recommended-practices/recommended-practice-burn-severity/in-detail/normalized-burn-ratio
van Wagtendonk, J.W., Root, R.R., Key, C. H., (2004) Comparison of AVIRIS and Landsat ETM+ detection capabilities for burn severity, Remote Sensing of Environment, 92 (3), 397-408 https://doi.org/10.1016/j.rse.2003.12.015
Accuracy
There are a number of limitations when using this dataset to locate or map burnt area. There are limitations that apply to all Earth Observations with satellites and those specific to this product.
Limitations of Earth Observations
Observation of the landscape by this service depends on having clear skies. Both cloud and smoke will obstruct the observation of the Earth’s surface. Furthermore, the satellites do not observe all places all of the time. The two Sentinel-2 satellites (A and B), which are the basis for this service, each view a given 320 kilometre wide strip of Australia only once every 10 days. This means there will be up to a five day gap between observations of any point on the Australian continent. The observations show only what was visible on the day of the satellite pass and at the time it is overhead.
Fires are fast moving and the situation on the ground can change rapidly. No decisions on life or property should be made based on this data. For local updates and alerts, please refer to your state emergency or fire service
Limitations specific to this dataset
A number of changes in the landscape with similar characteristics to burn appear in this dataset. These include but are not limited to:
Forestry harvesting
Land clearing
Vegetation dieback
Extreme dry conditions during a drought
Increase in water body area
A number of factors may contribute to a burnt area from an actual fire not being visible in this product. Potential situations in which a burnt area may appear to have very little or no change from the baseline state are as follows:
A burn in shrubland or grassland that experiences a seasonal or less frequent cycle of greening and drying out will not appear strongly in the dataset. This is due to the baseline image being quite dry. As a result this area will appear sparsely vegetated in the baseline and little change will be seen to occur.
Burns with low severity that only burn the understory in forested areas will be difficult to identify. This is due to the remaining green canopy obscuring the signal of the burn. This is likely to affect the detection and mapping of cool season control burns.
Quality assurance
Product accuracy is firstly dependent on the accuracy of the underpinning Earth Observation data. The daily Sentinel-2 (A and B combined) NRT provisional satellite data provides analysis-ready data that is processed on receipt using the best-available ancillary information at the time to provide atmospheric corrections.
These Earth Observation metrics are based on rigorous and peer reviewed research and have been used within the wider scientific community to understand burn characteristics within the landscape. However, this methodology has not been used as a near real-time and continuously processing continental scale output, such as in our web mapping service. The use of these metrics and this data is preliminary and provisional in nature and is still undergoing further development. These metrics should be used as a preliminary screening tool, and not an accurate identification of fire extent. These metrics should be used in combination with each other and can be used with other datasets to strengthen the agreement that the area has indeed been burnt. No decisions on life or property should be made based on this data.
To mitigate the impact of poor quality observations and other artefacts, locations with nodata (-999) values have been removed from the input dataset and then the data are screened using the Pixel Quality product (fmask) to remove cloud, cloud shadow, water and snow; leaving only “valid” data. However, it should be noted some poor pixels are likely to still be included in the data after screening.
Access the data
Explore data availability |
Learn how to use the DEA Explorer |
|
Get the data online |
Learn how to access the data via AWS |
Use constraints
These are Provisional Burnt Area products, designed for fast delivery of general burn extents using Provisional Sentinel-2 data, which has not been fully calibrated to enable as-fast-as-possible delivery for emergency use. As such these will be of lower accuracy and quality than fully calibrated data.
Old versions
View previous versions of this data product.
Acknowledgments
Contains modified Copernicus Sentinel data 2021-2023.
License and copyright
© Commonwealth of Australia (Geoscience Australia).
Released under Creative Commons Attribution 4.0 International Licence.