DEA Fractional Cover Percentiles (Landsat)
DEA Fractional Cover Percentiles (Landsat)
Geoscience Australia Landsat Fractional Cover Percentiles Collection 3
- Version:
3.0.0 (Latest)
- Product types:
Derivative, Raster
- Time span:
1987 – Present
- Update frequency:
Yearly
- Product ID:
ga_ls_fc_pc_cyear_3
About
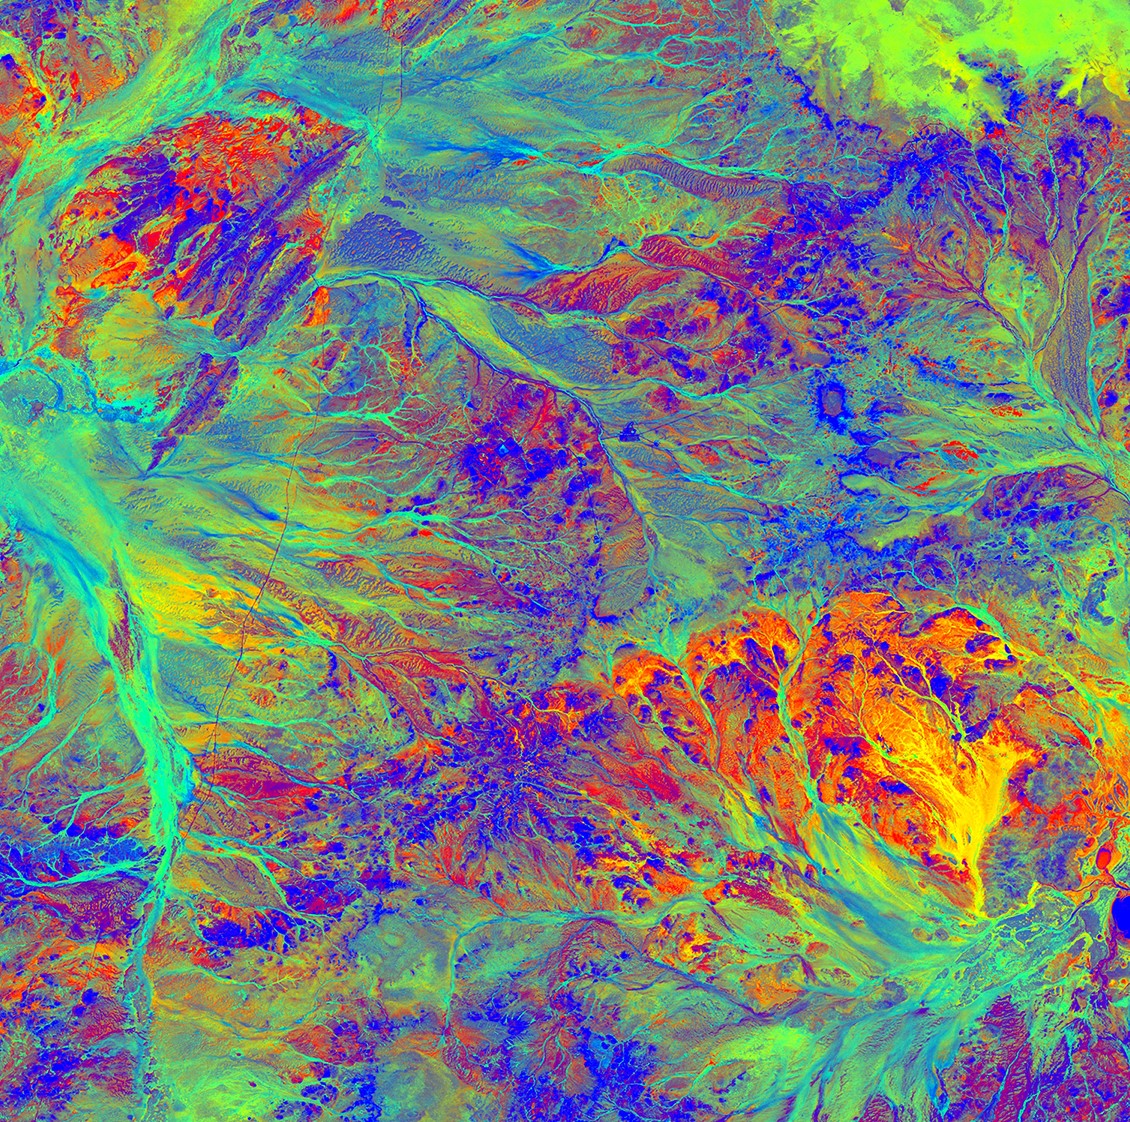
This product is designed to make it easier to analyse and interpret fractional cover. It uses the Fractional Cover (Landsat) product and calculates the statistical summaries (10th, 50th and 90th percentile) of fractional cover per epoch (annual).
New version in development
A new version of this product is being developed. Subscribe to the DEA newsletter to be notified of product releases.
Access the data
For help accessing the data, see the Access tab.
Digital Earth Australia - Public Data
Data explorer
Key details
Parent product(s) |
|
Collection |
Geoscience Australia Landsat Collection 3 |
Persistent ID |
|
Licence |
Cite this product
Data citation |
Lymburner, L., 2021. Geoscience Australia Landsat Fractional Cover Percentiles Collection 3. Geoscience Australia, Canberra. https://pid.geoscience.gov.au/dataset/ga/145501
|
Paper citation |
Scarth, P., Roder, A., Schmidt, M., 2010. Tracking grazing pressure and climate interaction - the role of Landsat fractional cover in time series analysis. Proceedings of the 15th Australasian Remote Sensing & Photogrammetry Conference. http://dx.doi.org/10.6084/M9.FIGSHARE.94250
|
Publications
Scarth, P., Roder, A. and Schmidt, M. (2010). Tracking grazing pressure and climate interaction - the role of Landsat fractional cover in time series analysis. Proceedings of the 15th Australasian Remote Sensing & Photogrammetry Conference.
Schmidt, M., Denham, R. and Scarth, P. (2010), Fractional ground cover monitoring of pastures and agricultural areas in Queensland. Proceedings of the 15th Australasian Remote Sensing & Photogrammetry Conference.
Background
The Fractional Cover (Landsat) product, developed by the Joint Remote Sensing Research Program, provides information about the the proportions of:
green vegetation
non-green vegetation (including deciduous trees during autumn and dry grass)
bare areas
for every 30m x 30m ground footprint.
It provides insight into how areas of dry vegetation and/or bare soil and green vegetation are changing over time.
It is important to be able to analyse and interpret fractional cover. For example, the 90th percentile of bare soil for a particular year will identify areas that have experienced a high portion of bare soil during that year.
What this product offers
This product is designed to make it easier to analyse and interpret fractional cover. It uses the Fractional Cover (Landsat) product and calculates the statistical summaries (10th, 50th and 90th percentile) of fractional cover per epoch (annual).
This product is available in the following form:
Applications
This product provides valuable information for a range of environmental and agricultural applications, including:
soil erosion monitoring
land surface process modelling
land management practices (e.g. crop rotation, stubble management, rangeland management)
vegetation studies
fuel load estimation
ecosystem modelling
Technical information
FC-PERCENTILE-ANNUAL-SUMMARY
This contains a (10th, 50th and 90th percentile) of bare, green and non-green vegetation of observations acquired in each full calendar year (1st of January - 31st December) from 1987 to the most recent full calendar year.
This product provides continental composites for each cover fraction.
The percentile ranges for each compositing period can be used to identify the ‘greenest’ observation i.e. 90th percentile of green cover and ‘barest’ observation i.e. 90th percentile of bare soil that occurred within the compositing period.
The 10th and 90th percentile are used in preference to the minimum and maximum values because they are less prone to residual noise associated with undetected cloud/cloud shadow. The 50th percentile (median) are used in preference to the mean as the median is less prone to being skewed by extreme values. It is worth noting that some undetected cloud and cloud shadow artefacts may still be present in the 10th and 90th percentiles, especially in areas with frequent cloud cover such as the wet tropics and Tasmania.
To account for satellite availability and status the statistics are calculated using the following satellites for the following periods of time:
1987-1998 : Landsat 5 only
1999 : Landsat 5 and Landsat 7
2000-2002 : Landsat 7 only
2003 : Landsat 5 and Landsat 7
2004-2010 : Landsat 5 only
2011-2012 : Landsat 7 only
2013 onward : Landsat 8 only
The values for this product are scaled as follows:
For the fractional cover bands (PV, NPV, BS)
0-100 = fractional cover values that range between 0 and 100%
Due to model uncertainties and the limitations of the training data, some areas may show cover values in excess of 100%. These areas can either be excluded or treated as equivalent to 100%
For the unmixing error (UE) band, the values are scaled between 0 and 127. High unmixing error values represent areas of high model uncertainty (areas of water, cloud, cloud shadow or soil types/colours that were not included in the model training data).
The DEA Landsat Collection 3 Fractional Cover Percentiles Summary products share the following attributes:
Each product’s datasets will:
be divided into tiles of 3200 x 3200 pixels, with a pixel size of 30m^2
be presented in EPSG:3577
Percentiles
10th, 50th and 90th Percentiles are calculated per Fractional Cover measurement - Bare Soil, Photosynthetic Vegetation, Non-Photosynthetic Vegetation. DEA Fractional Cover C3 and DEA Water Observations C3 are used as the input to these products.
Fractional Cover Masking
DEA Water Observations are used to identify clear pixels from DEA Fractional Cover to be included in percentile calculation. A Fractional Cover observation is included if:
It has corresponding DEA Water Observation information. If an observation within DEA Fractional Cover has no corresponding Water Observation, it is discarded. This can happen for ARD scenes that do not meet the GQA threshold for Water Observation generation.
The DEA Water Observation has the following characteristics:
It is contiguous
It is not saturated
It is not cloud
It is not cloud shadow
It is not terrain shadow
It is not low solar angle
It can be high slope
It is not wet
There are at least 3 clear and dry observations for the time period.
Please note, no land/sea masking is applied
Observation dates for given percentiles are not captured
Temporal period
Will be calculated from the 1st of January to the 31st of December (inclusive) for every available year of DEA Landsat Collection 3 Water Observations and DEA Landsat Collection 3 Fractional Cover observations.
It will have a directory structure of form:
/ga_ls_fc_pc_cyear_3/3-0-0/x01/y02/2000--P1Y/ga_ls_fc_pc_cyear_3_x01y02_2000--P1Y_bs_pc_10.tif
Lineage
Nationally consistent information about fractional cover (FC) dynamics is essential to addressing a range of natural resource challenges. These include land management practices, air quality, soil erosion, rangeland condition and soil carbon dynamics.
The fractional cover algorithm was developed by the Joint Remote Sensing Research Program (JRSRP) and is described in Scarth et al. (2010). While originally calibrated in Queensland, a large collaborative effort between The Department of Agriculture - ABARES and State and Territory governments to collect additional calibration data has enabled the calibration to extend to the entire Australian continent.
FC was made possible by new scientific and technical capabilities, the collaborative framework established by the Terrestrial Ecosystem Research Network (TERN) through the National Collaborative Research Infrastructure Strategy (NCRIS), and collaborative effort between state and Commonwealth governments.
Processing steps
Fractional Cover (FC) provides a representation of the proportions of living vegetation, dry and dying vegetation (including deciduous trees during autumn, dying grass, etc.), and bare soils across the Australian continent for any point in time in the Landsat archive since 1987. FC can potentially provide insight into areas of dry/dying vegetation and/or bare soil as well as allowing the mapping of living vegetation extent.
Fractional cover data can be used to identify large scale patterns and trends and inform evidence based decision making and policy on topics including wind and water erosion risk, soil carbon dynamics, land management practices and rangeland condition. This information could enable policy agencies, natural and agricultural land resource managers, and scientists to monitor land conditions over large areas over long time frames.
The Fractional Cover (FC) algorithm was developed by the Joint Remote Sensing Research Program and is described in described in Scarth et al. (2010). It has been implemented by Geoscience Australia for every observation from Landsat Thematic Mapper (Landsat 5), Enhanced Thematic Mapper (Landsat 7) and Operational Land Imager (Landsat 8) acquired since 1987. It is calculated from surface reflectance data.
FC provides a fractional cover representation of the proportions of green or photosynthetic vegetation, non-photosynthetic vegetation, and bare surface cover across the Australian continent. The fractions are retrieved by inverting multiple linear regression estimates and using synthetic endmembers in a constrained non-negative least squares unmixing model. For further information please see Scarth et al., 2010 and Schmidt et al., 2010.
References
Flood, N. (2014). Continuity of reflectance data between Landsat-7 ETM+ and Landsat-8 OLI, for both top-of-atmosphere and surface reflectance: A study in the Australian landscape. Remote Sensing, 6(9), 7952–7970. https://doi.org/10.3390/rs6097952
Muir, J., Schmidt, M., Tindall, D., Trevithick, R., Scarth, P. and Stewart, J.B. (2011). Guidelines for field measurement of fractional ground cover: a technical handbook supporting the Australian Collaborative Land Use and Management Program. Queensland Department of Environment and Resource Management for the Australian Bureau of Agricultural and Resource Economics and Sciences.
Scarth, P., Roder, A. and Schmidt, M. (2010). Tracking grazing pressure and climate interaction - the role of Landsat fractional cover in time series analysis. Proceedings of the 15th Australasian Remote Sensing & Photogrammetry Conference.
Schmidt, M., Denham, R. and Scarth, P. (2010), Fractional ground cover monitoring of pastures and agricultural areas in Queensland. Proceedings of the 15th Australasian Remote Sensing & Photogrammetry Conference.
Quality assurance
QA enumeration
To assist with the downstream calculation of the DEA Mangrove Canopy Cover product, each pixel has an additional enumeration associated with it:
0 |
Not enough observations to calculate percentiles (less than 3 clear and dry observations), and there is at least one observation that has been identified as wet. Defined in ODC configuration as: insufficient observations wet. |
1 |
Not enough observations to calculate percentiles (less than 3 clear and dry observations), but never identified as wet. Defined in ODC configuration as: insufficient observations dry. |
2 |
There are sufficient observations to compute percentiles (3 or more clear and dry observations). Defined in ODC configuration as: sufficient observations |
This enumeration assists in quantifying uncertainty within the DEA Mangrove Canopy Cover (see Mangrove Canopy Cover definition).
Side car files
Collection 3 Fractional Cover Percentiles will be accompanied by the following metadata, presentation and quality assurance side car files:
|
EODatasets 3 compatible ODC dataset definition |
|
Listing of python libraries and versions used by software to generate |
|
Cryptographic hash of data to validate distributed data |
|
Quick look thumbnail of a scaled RGB rendering of R = |
|
STAC 1.0.0 STAC document |
Access the data
Get the data online |
Learn how to access the data via AWS |
|
Code sample |
Learn how to use the DEA Sandbox |
How to view the data in a web map
To view and access the data interactively:
Visit DEA Maps.
Click
Explore map data.Select
Land and Vegetation>DEA Fractional Cover>DEA Fractional Cover Percentiles Calendar Year (Landsat).Click
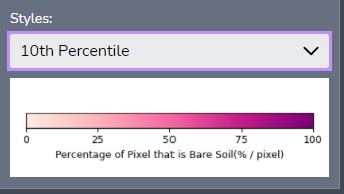
Add to the map, or the+symbol to add the data to the map.Chose the Percentile you would like to display from the drop down Styles menu
Old versions
View previous versions of this data product.
Changelog
2024-01-24: Fractional Cover Percentiles 2023 annual summary released
Product id: ga_ls_fc_pc_cyear_3
To access the updated product, see the Access tab.
Acknowledgments
Landsat data is provided by the United States Geological Survey (USGS) through direct reception of the data at Geoscience Australias satellite reception facility or download.
The fractional cover algorithm was developed by the Joint Remote Sensing Research Program (JRSRP) and is described in Scarth et al. (2010).
While originally calibrated in Queensland, a large collaborative effort between The Department of Agriculture & ABARES and State and Territory governments to collect additional calibration data has enabled the calibration to extend to the entire Australian continent. FC_25 was made possible by new scientific and technical capabilities, the collaborative framework established by the Terrestrial Ecosystem Research Network (TERN) through the National Collaborative Research Infrastructure Strategy (NCRIS), and collaborative effort between state and Commonwealth governments.
License and copyright
© Commonwealth of Australia (Geoscience Australia).
Released under Creative Commons Attribution 4.0 International Licence.