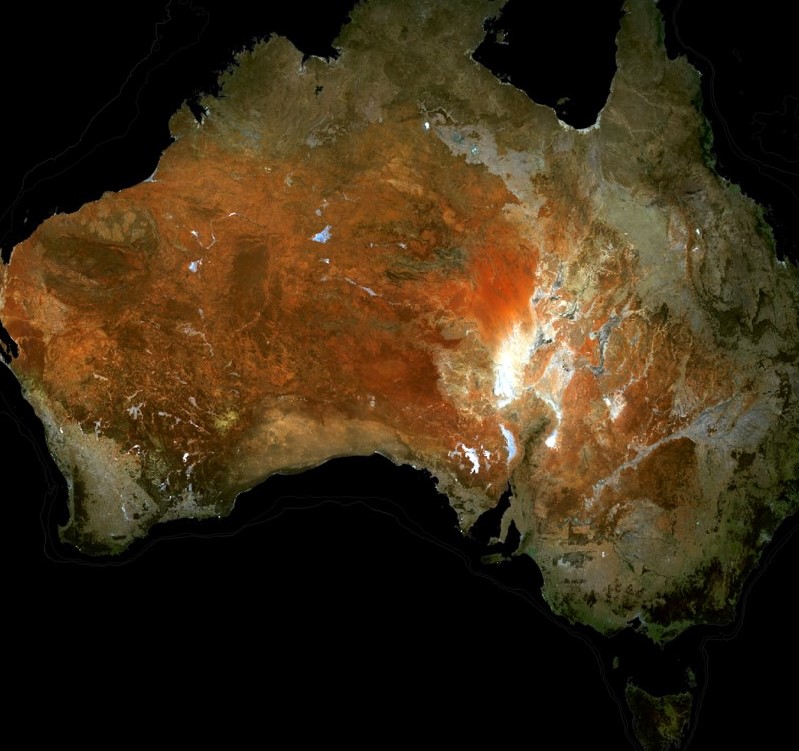
DEA Geometric Median and Median Absolute Deviation (Landsat)
DEA Geometric Median and Median Absolute Deviation (Landsat)
Geoscience Australia Landsat Geometric Median and Median Absolute Deviation Collection 3
- Version:
3.1.0 (Latest)
- Product types:
Derivative, Raster
- Time span:
1986 – 2022
- Update frequency:
Yearly
- Product IDs:
ga_ls5t_nbart_gm_cyear_3, ga_ls7e_nbart_gm_cyear_3, ga_ls8c_nbart_gm_cyear_3
About
The DEA Geometric Median and Median Absolute Deviation products use statistical analyses to provide information on variance in the landscape over the given year. They provide insight into the “average” conditions observed over Australia in a given year, as well as the amount of variability experienced around that average. These products are useful for monitoring change detection, such as from cropping, urban expansion or burnt area mapping.
New version in development
A new version of this product is being developed. Subscribe to the DEA newsletter to be notified of product releases.
Access the data
For help accessing the data, see the Access tab.
See it on a map
Data explorer
Access the data on AWS
Annual Landsat 5 observations on NCI
Annual Landsat 7 observations on NCI
Annual Landsat 8 observations on NCI
Web Services
Key details
Parent product(s) |
|
Collection |
Geoscience Australia Landsat Collection 3 |
DOI |
|
Licence |
Cite this product
Data citation |
Geoscience Australia, 2022. DEA Geometric Median and Median Absolute Deviation (Landsat). Geoscience Australia, Canberra. https://dx.doi.org/10.26186/146261
|
Publications
Roberts, D., Mueller, N., & Mcintyre, A. (2017). High-dimensional pixel composites from earth observation time series. IEEE Transactions on Geoscience and Remote Sensing, 55(11), 6254–6264. https://doi.org/10.1109/TGRS.2017.2723896
Roberts, D., Dunn, B., & Mueller, N. (2018). Open data cube products using high-dimensional statistics of time series. IGARSS 2018 - 2018 IEEE International Geoscience and Remote Sensing Symposium, 8647–8650. https://doi.org/10.1109/IGARSS.2018.8518312
Background
Large-scale image composites are increasingly important for a variety of applications such as land cover mapping, change detection, and the generation of high-quality data to parameterise and validate bio-physical and geophysical models. A number of compositing methodologies are being used in remote sensing in general; however challenges such as maintaining the spectral relationship between bands, mitigating against boundary artifacts due to mosaicking scenes from different epochs, and ensuring spatial regularity across the mosaic image still exist.
The creation of good composite images is a particularly important technology since the opening of the Landsat archive by the United States Geological Survey. The greater availability of satellite imagery has resulted in demand to provide large regional mosaics that are representative of conditions over specific time periods while also being free of clouds and other unwanted image noise. One approach is the stitching together of a number of clear images. Another is the creation of mosaics where pixels from different epochs are combined based on some algorithm from a time series of observations. This ‘pixel composite’ approach to mosaic generation provides a more consistent result compared with stitching clear images due to the improved color balance created by the combining of one-by-one pixel representative images. Another strength of pixel-based composites is their ability to be automated for application to very large data collections and time series such as national satellite data archives.
When deriving information from satellite images it may be beneficial to see how an area usually looks over a given year rather than how it was viewed at a single point in time. Other useful interpretations include how dynamic or variable the Australian landscape is over any given year, especially to help with understanding how the landscape changes, or to discriminate parts of the landscape that stay the same throughout the year (like bare rock), from those areas that go through big changes in cover (such as cropping areas).
By understanding general conditions (which can be thought of as “average” for the year) and the different patterns of variation, we can characterise various types of land cover and land use, and detect changes of significance in the landscape.
The Geometric Median provides information on the general conditions of the landscape for a given year.
The Median Absolute Deviation provides information on how the landscape is changing in the same year.
The DEA GeoMAD product combines the Geometric Median and the Median Absolute Deviation in a single, annually produced package.
What this product offers
This product provides statistical tools to exploit the time series of Earth observation data available in Digital Earth Australia, providing annual images of general conditions and how much an area changes for a given year.
The geomedian part of the product provides an “average” cloud-free image over the given year. The geomedian image is calculated with a multi-dimensional median, using all the spectral measurements from the satellite imagery at the same time in order to maintain the relationships among the measurements.
The median absolute deviation part of the product uses three measures of variance, each of which provides a “second order” high dimensional statistical composite for the given year. The three variance measures show how much an area varies from the “average” in terms of “distance” based on factors such as brightness and spectra:
Euclidean distance (EMAD)
Cosine (spectral) distance (SMAD)
Bray Curtis dissimilarity (BCMAD)
Together, they provide information on variance in the landscape over the given year and are useful for change detection applications.
Applications
The GeoMAD product is useful for:
Land cover mapping
Change detection and classification (such as for burn area mapping, crop mapping, urban area mapping)
General variance and change, so it can be used in machine learning for change detection
Environmental monitoring
Technical information
Geometric Median
The surface reflectance geometric median (geomedian) provides an approach that leverages high-dimensional statistical theory to deliver a spectrally consistent, artefact-free pixel composite product.
The geomedian is a pixel composite mosaic of a time series of earth observations. Essentially the value of a pixel in a geomedian image is the statistical median of all observations for that pixel from a period of time. For example the 2016 Landsat 8 geomedian image over an area will be the median of Landsat 8 pixels observed for that area in 2016.
An annual geometric median is a high-dimensional median calculated from the reflectance values drawn from a calendar year. The years available are each full calendar year since 1988. The annual geomedians of surface reflectance measurements are calculated per calendar year, on individual sensors (ie. only Landsat 5 TM or Landsat 7 ETM+ or Landsat 8 OLI).
Multispectral satellite imagery, such as is available from Landsat and Sentinel-2, consists of multiple measurements per pixel: one for each spectral band. In order to create a meaningful median, a median pixel must take all concurrent spectral measurements into account simultaneously as a multi-dimensional set, rather than each measurement independently as occurs with a simple median. The geomedian is a high-dimensional statistic, which calculates a multi-dimensional median from all the spectral measurements from the satellite imagery at the same time, and maintains the relationships among the measurements. This provides a median of the physical conditions measured by the earth observations used to create it, and provides a good representation of a typical pixel observation devoid of outliers, and exhibits reduced spatial noise.
The annual geomedian provides an annual surface reflectance composite for any area of interest within the area covered by the DEA data cube, up to the entire spatial extent available (continental). It provides a cloud-free overview of the middle surface reflectance value for each year and as it is equivariant (i.e. a linear algorithm applied to a geomedian image is equal to a geomedian applied to a set of images on which the same linear algorithm was applied) can be used in further analyses such as Tasseled Cap, Principal Components Analysis and Normalised Difference Indices. It is useful in analyses requiring baseline conditions such as change detection.
Surface reflectance geometric median products are derived from the DEA Surface Reflectance (SR) products, and provide a representation of the middle of surface reflectance over the time period, which can be considered “average” conditions. This is a synthetic representation of a time series rather than an actual observed pixel.
The geomedian (Roberts et al 2017) is used in preference to the mean, as the mean can be adversely effected by extrema whereas the median is less sensitive to outliers. The geomedian is used in preference to the basic median, as it preserves the physical relationship between spectral measurements which the basic median does not. The geometric median is used in preference to the medoid (Flood 2013) where a low noise composite is required. Where the provenance of each pixel in a composite is required the medoid is the preferred method and the geomedian should not be used.
The input data used to calculate the geomedian are filtered to remove poor quality observations including cloud, cloud shadow, band saturation (of any band) using the Pixel Quality Assessment (PQA) product. To account for satellite availability and status the statistics are calculated using the following satellites/sensors for the following periods of time:
1988-1999 : Landsat 5 only
2000-2003 : Landsat 7 only
2004-2007 : Landsat 5 and Landsat 7 (as separate geomedian products)
2008: Landsat 7 only
2009-2011: Landsat 5 and Landsat 7 (as separate geomedian products)
2012 : Landsat 7 only
2013 onward : Landsat 7 and Landsat 8 (as separate geomedian products)
The primary uses of geomedian pixel composites are for baselines for change detection, and for broad regional image composites (such as national and continental mosaics).
Median Absolute Deviation
The ‘first order’ statistics of a set of data include the mean and the median. Instead of the mean, for multi-dimensional datasets such as satellite imagery, the median provides a method to find general conditions for a time period while also maintaining the physical relationships between spectral measurements.
A ‘second order’ statistic associated with a mean of a set of data is the standard deviation, providing a measure of data variance. The equivalent second order statistic associated with the median is the Median Absolute Deviation (MAD), which provides the associated variance measures for the median.
The MAD is the median of absolute differences of the individual values in a set of data from their overall median. To calculate the MAD for a multi-dimensional dataset, such as the set of satellite images captured in a year, measures of “distance” from each multi-dimensional measurement (i.e. the set of spectral measurements for a pixel through time, being blue, green, red, near-infra-red, and short-wave-infra-red) to the mean are needed. However multi-dimensional distances can be calculated in different ways, providing different insights into the behaviour of pixels through time. The DEA GeoMAD product includes three MADs produced from different measures of distance as follows:
Euclidean distance (EMAD) is more sensitive to changes in target brightness.
Cosine (spectral) distance (SMAD) is more sensitive to change in target spectral response.
Bray Curtis dissimilarity (BCMAD) is more sensitive to the distribution of the observation values through time.
Each MAD provides information on different land cover change features and is useful in classification.
The mathematical derivation of the three MADs can be found in Roberts et al (2018).
Lineage
The GeoMAD is derived from Landsat surface reflectance data. The data are masked for cloud, shadows and other image artefacts using the associated pixel quality product to help provide as clear a set of observations as possible from which to calculate the medians.
The three MAD layers of the GeoMAD are calculated by computing the multidimensional distance between each observation in a time series of multispectral (or higher dimensionality such as hyperspectral) satellite imagery with the multidimensional median of the time series. The median used for this calculation is the geometric median corresponding to the time series.
The GeoMAD is calculated over annual time periods on Earth observations from a single sensor by default (such as the annual time series of Landsat 8 observations); however, it is applicable to multi-sensor time series of any length that computing resources can support.
For the purposes of the default Digital Earth Australia product, GeoMADs are computed per calendar year, per sensor (Landsat 5, Landsat 7 and Landsat 8) from terrain-illumination-corrected surface reflectance data (Analysis Ready Data), and compared to the annual geometric median of that data.
Note: the constituent pixels in the GeoMAD pixel composite mosaics are synthetic, meaning that the pixels have not been physically observed by the satellite. Rather they are the computed high-dimensional medians of a time series of pixels.
References
Roberts, D., Mueller, N., & Mcintyre, A. (2017). High-dimensional pixel composites from earth observation time series. IEEE Transactions on Geoscience and Remote Sensing, 55(11), 6254–6264. https://doi.org/10.1109/TGRS.2017.2723896
Roberts, D., Dunn, B., & Mueller, N. (2018). Open data cube products using high-dimensional statistics of time series. IGARSS 2018 - 2018 IEEE International Geoscience and Remote Sensing Symposium, 8647–8650. https://doi.org/10.1109/IGARSS.2018.8518312
Accuracy
The accuracy of the GeoMAD layers is dependent on the accuracy of the underpinning earth observation data. As the values of the geomedian and MAD are synthetic (not observed directly by satellite), they cannot be verified by field work.
To calculate a geomedian or MAD representative of clear observations, the majority of the input data must be clear of clouds, shadows or other issues that can adversely affect an observation. Where a location experiences more than 50% of time under the impact of clouds and shadows (such as areas of Tasmania) the GeoMAD can produce an output that is essentially cloud / shadow noise. As such it is necessary to use a large enough collection of data to enable clear medians to be calculated. To mitigate the impact of poor quality observations and other artefacts, the input data is first screened using the Pixel Quality product, however some poor pixels are likely to still be included in the data after screening. Increasing the period from which observations are included in the input dataset also helps to mitigate the issue. Where no-data pixels occur in locations that clear observations should occur, the cause is a lack of clear pixels to populate the GeoMAD.
Access the data
See it on a map |
Learn how to use DEA Maps |
|
Explore data availability |
Learn how to use the DEA Explorer |
|
Get the data online |
Learn how to access the data via AWS |
|
Get via web service |
Learn how to use DEA’s web services |
Accessing the OGC web services
When accessing via the Digital Earth Australia OGC Web Services, the layer names for the three Landsat 8, Landsat 7 and Landsat 5 products respectively are:
ga_ls8c_nbart_gm_cyear_3ga_ls7e_nbart_gm_cyear_3ga_ls5t_nbart_gm_cyear_3
Old versions
View previous versions of this data product.
2.1.0: DEA Surface Reflectance Median Absolute Deviation (Landsat) |
Acknowledgments
The high-dimensional statistics algorithms incorporated in this product is the work of Dr Dale Roberts, Australian National University.
License and copyright
© Commonwealth of Australia (Geoscience Australia).
Released under Creative Commons Attribution 4.0 International Licence.