DEA Hotspots
DEA Hotspots
Digital Earth Australia Hotspots
- Version:
1.0.0 (Latest)
- Product types:
Data service, Vector
- Time span:
27/08/2002 – Present
- Update frequency:
Every 10 minutes
Important
DEA Hotspots is not to be used for safety of life decisions.
About
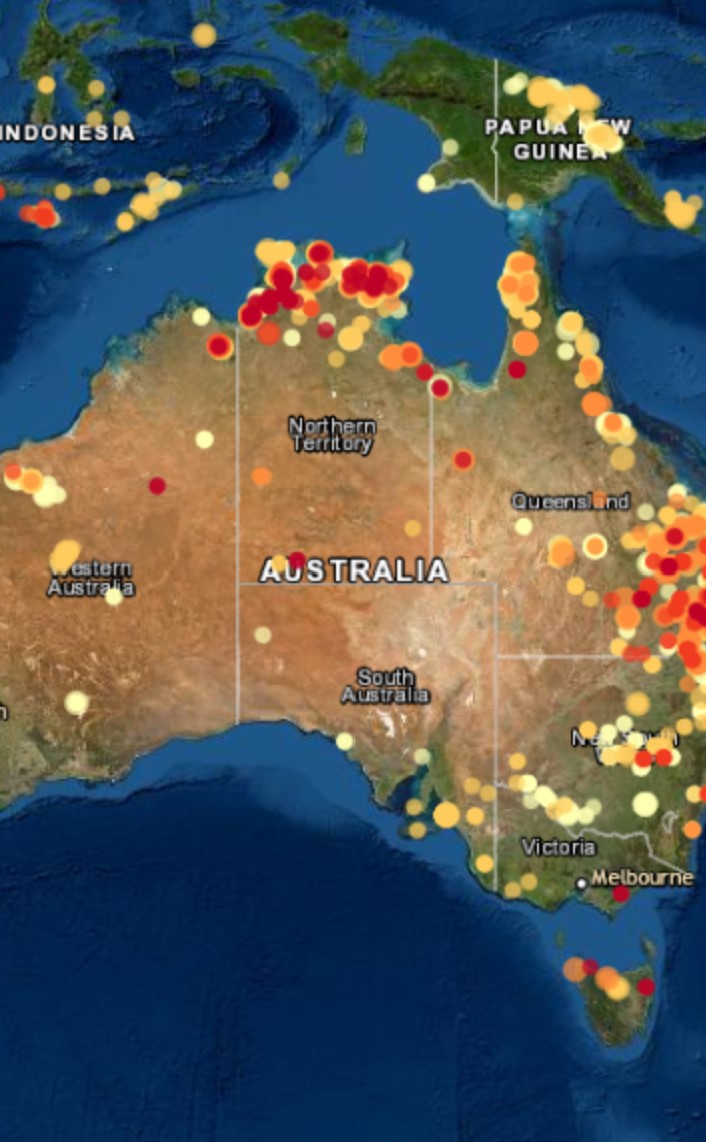
Digital Earth Australia (DEA) Hotspots is a national bushfire monitoring system that uses satellite sensors to detect areas producing high levels of infrared radiation — called Hotspots — to allow users to identify potential fire locations with a possible threat to communities and property.
Access the data
For help accessing the data, see the Access tab.
See it on a map
DEA Hotspots Secure Access
Access the data on AWS
Web Mapping Service (WMS)
Web Feature Service (WFS)
KML (last 3 days)
GeoJSON (last 3 days)
Key details
Persistent ID |
|
Licence |
Cite this product
Data citation |
Geoscience Australia, 2020. Digital Earth Australia Hotspots dataset. Geoscience Australia, Canberra. https://pid.geoscience.gov.au/dataset/ga/111881
|
Background
Bushfires are a natural part of the Australian landscape. Many of our native flora and fauna have adapted to the specific fire regimes of the regions in which they live.
It is important we are able to accurately map and monitor fires on a near real-time basis. This information allows emergency services to control bushfires and develop risk assessments and disaster relief plans.
What this product offers
Digital Earth Australia (DEA) Hotspots is a national bushfire monitoring system that provides timely information about hotspots to emergency service managers and critical infrastructure providers across Australia. Updated with new information every 10 minutes, the mapping system uses satellite sensors to detect areas producing high levels of infrared radiation (called Hotspots) to allow users to identify potential fire locations with a possible risk to communities and property.
DEA Hotspots is not published in real time and should not be used for safety of life decisions.
There are two versions of the DEA Hotspots system:
DEA Hotspots public version: https://hotspots.dea.ga.gov.au/
Available for anyone to access and use
DEA Hotspots secure users’ version: https://hotspots.dea.ga.gov.au/login
Available for emergency managers and associated organisations
Provides priority access to the system during periods of high demand
Includes additional sources of Hotspot information
To apply for access, email earth.observation@ga.gov.au
Applications
Hotspots can indicate possible active fires in some circumstances. Taken as an ensemble, Hotspots provide an overview of thermal activity in Australia and capture the pattern of possible fires across the Australian continent over time.
This application allows you to visualise, search and download current and historic Hotspot data for any location Australia-wide.
You can also overlay satellite passes, topography, burnt areas, and other imagery sources such as Sentinel 2A & 2B Near Real-Time products.
The system can be used by:
emergency services
Emergency management agencies use Hotspots as one of many operational data feeds to inform their broad situational awareness of, and at times tactical response to, fires.
climate change researchers
the media
policy makers
the broader public
Technical information
Important notes about Hotspots
Each Hotspot is represented by a spot on the map, derived from (a growing number of) satellite-born instruments that detect light in the thermal wavelengths.
Hotspots can indicate possible active fires in some circumstances. Taken as an ensemble, Hotspots provide an overview of thermal activity in Australia and capture the pattern of possible fires across the Australian continent overtime.
Emergency management agencies use Hotspots as one of many operational data feeds to inform their broad situational awareness of, and at times tactical response to, fires.
DEA Hotspots should not be used for safety of life decisions. For local updates and alerts, please refer to your state emergency or fire service.
Hotspots are not presented in real-time and not designed to be used in isolation of other data sources. It is not accurate enough to be relied upon for time-critical detection and location of fires.
The colour of the spot represents the time the Hotspot was last observed by a passing satellite (e.g., 0-2 hours). The colour does not indicate severity.
The size of the Hotspots does not indicate the size of the fire.
If you zoom in on the map you will notice that the size of the Hotspot dot will change.
The Hotspot location on any map (no matter how detailed) is only accurate to ± 375 m at best (VIIRS).
Hotspot data generation
At best, hotspots information is 17 minutes old (this is how long it takes to download and process data into hotspots after each satellite pass).
The Himawari-9 satellite is a geostationary satellite, which covers Australia at all times, and provides updates every 10 minutes, however the information is not published in real time.
All other satellites pass over a given area up to 4 times a day, and each pass covers only a part of Australia, which means some fires are not detected because the satellite was not looking over that area at the appropriate time.
Thermal infrared sensors on-board the satellites can detect areas with unusually high temperatures. We call these areas Hotspots.
Satellites and sensors
DEA Hotspot sources include the:
Moderate Resolution Imaging Spectroradiometer (MODIS) sensor on the National Aeronautics and Space Administration (NASA) Terra and Aqua polar orbiting satellites
Advanced Very High Resolution Radiometer (AVHRR) nighttime imagery from the National Oceanic and Atmospheric Administration (NOAA-19) polar orbiting satellite
Visible Infrared Imaging Radiometer Suite (VIIRS) on the Suomi National Polar orbiting Partnership (NPP) satellite and NOAA-20 polar orbiting satellite
Advanced Himawari Imager (AHI) sensor operated by the Japan Meteorological Agency (JMA) on the Himawari-9 geostationary satellite
Accuracy
Quality assurance
False positives (showing a Hotspot without an underlying cause) are possible.
False negatives (failing to show a Hotspot, despite a heated land surface, fire, etc.) are possible.
Hotspots are potential bushfires, but could also indicate other phenomena, such as gas fires, heavy industry, furnaces, smoke plumes, jet contrails and hot rocks.
Not all fires will be detected as Hotspots.
The Hotspot location on any map (no matter how detailed) is only accurate to ± 375 m at best (VIIRS).
Hotspots are not presented in real-time and not designed to be used in isolation of other data sources. It is not accurate enough to be relied upon for time-critical detection and location of fires.
Geostationary satellite derived products algorithms may be optimised for day or night conditions. For algorithms such as BRIGHT that provide hotspots every 10 minutes, 24 hours per day, temporal windows approximately +/- 1 hour of sunset and sunrise are considered unreliable periods.
No Hotspots are produced if satellite data is not received (e.g. for AHI, 0240 and 1440 UTC times are not received).
Hotspots should not be used for safety of life decisions. For local updates and alerts, please refer to your state emergency or fire service.
Depending on the sensor, generally, a flaming or smouldering fire would need to be at least 1,000 m2 to be recognised as a Hotspot. Under exceptional (and rare) conditions (no cloud, smoke, wind etc), a flaming fire at 50m2 may be detected. However, fires are often smaller than the size of the satellite pixel.
Missing Hotspots
Hotspots may be obscured or missing from the map due to the following reasons:
Polar Orbiting satellites are not designed to provide live updates on fire fronts, as they only look over the fire ground 4-7 times per day.
Optical satellites cannot see though clouds, heavy smoke or tree canopy.
Fires may be missed if they are relatively small or do not cover a spatial footprint large enough to be detected by the sensors (e.g. the MODIS footprint is 1km2).
Cool fires are not likely to be detected.
Sensors can be inoperable for extended periods of time, disrupting the detection of Hotspots.
The fire may have been burning during a time when no satellite was looking over the fire ground.
Access the data
See it on a map |
Learn how to use DEA Maps |
|
Get the data online |
Learn how to access the data via AWS |
|
Get via web service |
Learn how to use DEA’s web services |
Use constraints
DEA Hotspots is not to be used for safety of life decisions.
The information displayed on DEA Hotspots (the “Service”) is for general informational purposes only, and is not intended to provide any commercial, financial, or legal advice.
Please see the Geoscience Australia website for the full disclaimer notice.
Access the DEA Hotspots product description
The latest version of the DEA Hotspots product description is available in the DEA Hotspots AWS documents files folder.
Look for the file named “Product Description”. This document contains information about:
How to access DEA Hotspots
How to register for the secure DEA Hotspots site
DEA Hotspots algorithm details
How to access historical DEA Hotspots information
License and copyright
© Commonwealth of Australia (Geoscience Australia).
Released under Creative Commons Attribution 4.0 International Licence.