DEA Water Observations (Landsat)
DEA Water Observations (Landsat)
Geoscience Australia Landsat Water Observations Collection 3
- Version:
3.1.6 (Latest)
- Product types:
Derivative, Raster
- Time span:
16/08/1986 – Present
- Update frequency:
Daily
- Product ID:
ga_ls_wo_3
About
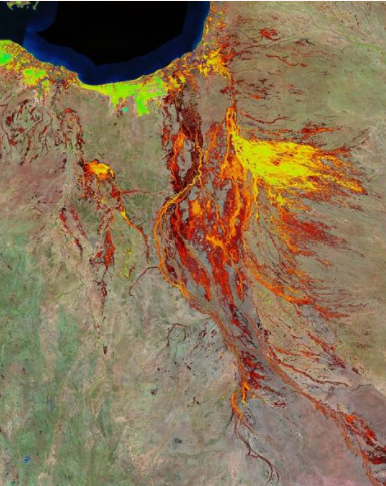
Digital Earth Australia (DEA) Water Observations uses an algorithm to classify each pixel from Landsat satellite imagery as ‘wet’, ‘dry’ or ‘invalid’. Combining the classified pixels into summaries, covering a year, season, or all of time (since 1986) gives the information on where water is usually, and where it is rarely.
New version in development
A new version of this product is being developed. Subscribe to the DEA newsletter to be notified of product releases.
Access the data
For help accessing the data, see the Access tab.
Data explorer
Access the data on AWS
Access the data on NCI
Code examples
Web Services
Key details
Parent product(s) |
|
Collection |
Geoscience Australia Landsat Collection 3 |
DOI |
|
Licence |
Cite this product
Data citation |
Geoscience Australia, 2022. DEA Water Observations. Geoscience Australia, Canberra. https://dx.doi.org/10.26186/146257
|
Paper citation |
Mueller, N., Lewis, A., Roberts, D., Ring, S., Melrose, R., Sixsmith, J., Lymburner, L., McIntyre, A., Tan, P., Curnow, S., & Ip, A., 2016. Water observations from space: Mapping surface water from 25 years of Landsat imagery across Australia. Remote Sensing of Environment, 174, 341–352. https://doi.org/10.1016/j.rse.2015.11.003
|
Publications
Mueller, N., Lewis, A., Roberts, D., Ring, S., Melrose, R., Sixsmith, J., Lymburner, L., McIntyre, A., Tan, P., Curnow, S., & Ip, A. (2016). Water observations from space: Mapping surface water from 25 years of Landsat imagery across Australia. Remote Sensing of Environment, 174, 341–352. https://doi.org/10.1016/j.rse.2015.11.003
Background
It is important to know where water is normally present in a landscape, where water is rarely observed, and where inundation has occasionally occurred.
These observations tell us where flooding has occurred in the past, and allows us to understand wetlands, water connectivity and surface-groundwater relationships. This can lead to more effective emergency management and risk assessment.
This is the principal Digital Earth Australia (DEA) Water product (previously known as Water Observations from Space (WOfS)), providing the individual water observations per satellite image that are subsequently used in the following DEA Water suite and related water bodies products: DEA Waterbodies (Landsat), DEA Water Observations Statistics (Landsat), DEA Water Observations Filtered Statistics (Landsat).
This product shows where surface water was observed by the Landsat satellites on any particular day since mid 1986. These daily data layers are termed Water Observations (WOs).
What this product offers
DEA Water Observations provides surface water observations derived from Landsat satellite imagery for all of Australia from 1986 to present.
The Water Observations show the extent of water in a corresponding Landsat scene, along with the degree to which the scene was obscured by clouds, shadows or where sensor problems cause parts of a scene to not be observable.
Applications
The DEA Water Observations (WOs) are used to determine the area of surface water present in the corresponding satellite scene, and can be used for several water monitoring applications. Uses of the individual WOs include:
flood extent
amount of water in water bodies, major rivers and the coastal zone.
As the WOs are separated from the derived statistics of the associated DEA Water statistical products, the WOs are most useful for performing analyses requiring the investigation of surface water extent for particular times rather than over long term time series.
Technical information
Digital Earth Australia (DEA) Water Observations (WOs) is a gridded dataset indicating areas where surface water has been observed using the Geoscience Australia (GA) Earth observation satellite data holdings. The current product (Version 3.1.6) includes observations taken between 1986 and the present (inclusive) from the Landsat 5, 7 and 8 satellites. WOs cover all of mainland Australia and Tasmania but exclude off-shore Territories. The dataset is updated automatically as each new Landsat scene is acquired and processed to Analysis Ready Data (ARD) state.
Data is provided as Water Observation Feature Layers (WOFLs), in a 1 to 1 relationship with the input satellite data. Hence there is one WOFL for each satellite dataset processed for the occurrence of water. The meaning of each bit in the WOFLs is given in the table below. Prior to version 2.1.5, only one bit could be set per pixel, therefore the value of a pixel in an Observation could be X OR Y OR Z. Hence in previous versions the WOs values could only be 0 or 1 or 2 or 4 or … or 128. From version 2.1.5 onward the data type has been changed to a bit field, where multiple bits can be set simultaneously. Hence the value of a pixel in an Observation can be X AND Y AND Z, etc, hence values can range from 0 to 255.
This version (3.1.6) has been further updated with changes to the way different factors impeding water detection are dealt with. These changes result in improved detection rates and allow discrimination of different factors impeding water observations. Masking of the ocean with a pre-defined mask has been removed, and the extent of the ocean is now defined by the algorithm. Masking for terrain and solar incident angle have been de-coupled in order to provide better visibility about the reason for masking. The solar incident angle threshold used to remove poor quality observations collected when the sun is at a very low angle has been reduced from 30 degrees to 10 degrees. This change increases the number of observations included in the dataset during winter months while still removing those that are most badly impacted by shadowing caused by low solar incident angle.
The table below describes the meaning of each bit set per pixel in each WOFL. Where multiple factors impeding a clear observation are detected all the respective bits will be set. For example a value of 136 indicates water (128) AND terrain shadow (8) were observed for the pixel.
Bit |
Flagging |
Decimal Value |
Description |
|---|---|---|---|
0 |
no data |
1 |
Pixel masked out due to NO_DATA in NBART source, 0 = valid data in NBART |
1 |
contiguity |
2 |
Pixel masked out due to lack of data contiguity |
2 |
solar incidence |
4 |
Pixel masked out due to solar incidence > 10 degrees |
3 |
terrain shadow |
8 |
Pixel masked out due to terrain shadow |
4 |
high slope |
16 |
Pixel masked out due to high slope |
5 |
cloud shadow |
32 |
Pixel masked out due to cloud shadow |
6 |
cloud |
64 |
Pixel masked out due to cloud |
7 |
water |
128 |
Water detected |
Full details of the original algorithms and features of DEA Water Observations can be found in the Water Observations from Space paper by Mueller et al. (2015).
Lineage
Digital Earth Australia (DEA) Water Observations is derived from Landsat 5, 7 and 8 imagery. Imagery is initially corrected to Analysis Ready Data (ARD) standard, and masked for cloud, cloud-shadow, data contiguity, steep slope, solar incidence angle, and terrain shadow. Water classification is achieved using a decision tree based on the individual spectral bands of the Landsat satellites and derived normalised difference indicies associated with water and vegetation. The output is then stored as an 8-bit, bit-field with values from 0 - 255 indicating the presence or absence of each mask type and the presence or absence of water.
Processing steps
The water detection algorithm used to detect water from each observed pixel is based on a statistical regression tree analysis of a set of normalised difference indices and corrected band values. The regression is based on a set of water and non-water samples created by visual interpretation of 20 Landsat scenes from across Australia. The sample locations, indicated below, ensure that the logistic regression is based on the full geographic range of conditions experienced in Australia.
The regression analysis determined a set of best indices and bands for the analysis and the associated thresholds in each component to derive a final classification tree, producing a water/non-water classification for pixel in the Data Cube. The final water classification for each pixel is modified by Pixel Quality (see associated PQ product information) and terrain. Once the water algorithm has completed its process, the water detection for a pixel through time is combined to produce a total number of water observations for each pixel. This is compared to a total number of clear observations for the same pixel, derived from the PQ analysis. The ratio is expressed as a percentage water recurrence.
Confidence that a pixel depicted as having had water detected at some time is calculated by a Confidence Layer. The layer is computed by combining a set of confidence factors using a weighted sum approach, with the weightings derived by logistic regression.
References
Mueller, N., Lewis, A., Roberts, D., Ring, S., Melrose, R., Sixsmith, J., Lymburner, L., McIntyre, A., Tan, P., Curnow, S., & Ip, A. (2016). Water observations from space: Mapping surface water from 25 years of Landsat imagery across Australia. Remote Sensing of Environment, 174, 341–352. https://doi.org/10.1016/j.rse.2015.11.003
Accuracy
The accuracy of the original Water Observations from Space (WOfS) algorithms was assessed using an independent set of 3.4 million validation points. The points were identified based on visual interpretation of Landsat imagery within 20 test areas across Australia. The points were identified in the same locations as the training data, but were selected from different years (i.e. imagery from one set of years was used to generate points to train the algorithm, and imagery from a separate set of years was used to generate the points that were used evaluate the accuracy of the algorithm).
The classification has an overall accuracy of 97%. Areas identified as water within the accuracy assessment data are being correctly identified 93% of the time and are being misclassified as not water 7% of the time. These errors of omission typically occur along rivers, small waterbodies and swamps where the presence of both water and vegetation within the pixel leads a failure to identify water. This means that the DEA Water Observations product is likely to underestimate the extent of water in locations that contain mixed water and vegetation pixels. As a consequence of this the product may not be fit for applications that require information about the inundation characteristics of vegetated wetlands, small farm dams, and rivers less than 50 metres wide.
Water can be incorrectly detected by the classification algorithm in areas where steep terrain or tall buildings cause frequently shaded pixels. These errors of commission are occurring in 8% of samples used to evaluate the accuracy of the classification. This means that the product may overestimate the amount of water in locations that are adjacent to steep terrain or in dense urban areas. Terrain masks and urban masks were used in the confidence layer to reduce this overestimation, however some residual errors remain. As a consequence of this the product may not be fit for applications that require information about the inundation characteristics of urban areas or locations adjacent to steep terrain.
In addition to the limitations of the classification algorithm, the satellite observation frequency also introduces limitations to the product. The product is likely to be underestimating the extent of inundation for infrequent flood events because the 8 day revisit frequency (best case scenario notwithstanding the possibility of cloud obscuring the floodwaters) will potentially fail to observe the flood peak. This is an intrinsic limitation of the observation strategy. As a consequence of this limitation, the product is not suited to applications that require a. the identification of a ‘maximum extent of inundation’ line, or b. detailed information about the extent of infrequent flood events.
Limitations
Observation of Earth by the satellites used for this service depends on clear skies. Furthermore, the satellites do not observe all places every day. The Landsat satellites, which are the basis for this service, view a given 185 kilometre wide strip of Australia only once every 16 days. The observations show only what was visible on the day of the satellite pass. As a result, not all historical floods will have been observed by satellite.
The automated surface water detection algorithm, which has been developed by Geoscience Australia, can sometimes mistakenly label large buildings; cloud shadow; large uniform black tarpaulins; or snow as “water”. The algorithm is designed to locate large areas of water and as a result may miss small water bodies.
The satellite archive used for this service is of limited duration (1986 to present), and subject to the cloud and repeat coverage restrictions noted above. In addition, Australia is subject to wide variations in weather and climate. Therefore the absence of water observations prior to 1986 in a particular location does not provide certainty that surface water will never be observed there in future.
The probability that surface water may appear at a given location may vary over time due to changes in drainage and other infrastructure (such as dams). Where such changes have occurred, the historical water observations for that location may no longer give a true picture of the future probability of surface water being observed.
Access the data
Explore data availability |
Learn how to use the DEA Explorer |
|
Get the data online |
Learn how to access the data via AWS |
|
Code sample |
Learn how to use the DEA Sandbox |
|
Get via web service |
Learn how to use DEA’s web services |
How to view the data in a web map
To view and access the data interactively:
Visit DEA Maps.
Click
Explore map data.Select
Inland water>DEA Water Observations>DEA Water Observations (Landsat).Click
Add to the map, or the+symbol to add the data to the map.
License and copyright
© Commonwealth of Australia (Geoscience Australia).
Released under Creative Commons Attribution 4.0 International Licence.