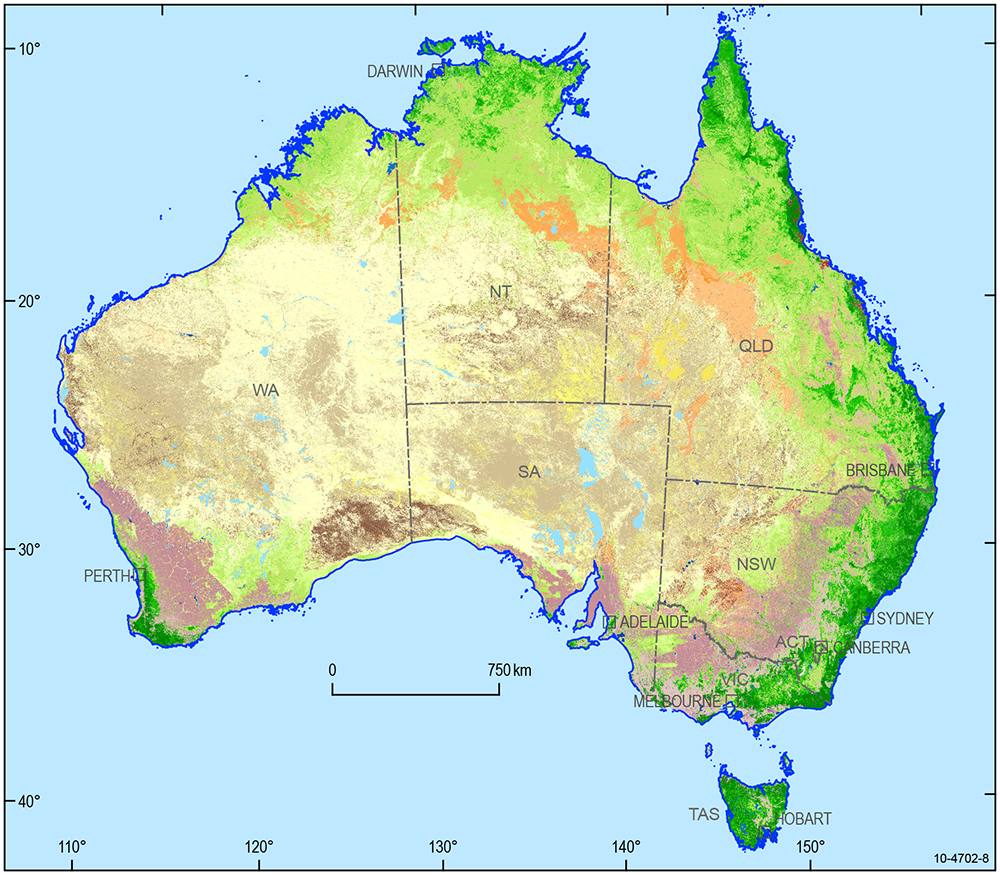
Geoscience Australia Land Cover (Terra MODIS)
Geoscience Australia Land Cover (Terra MODIS)
Dynamic Land Cover Dataset 250m 2.1.0
- Version:
2.1.0 (Latest)
- Product types:
Derivative, Raster
- Time span:
2002 – 2015
- Update frequency:
Every 2 years
- Next update:
No updates planned
- Product ID:
ga_ter_m_dlcd_ann
About
This product will be deprecated. It has been replaced by the current DEA Land Cover (Landsat) product.
Access the data
For help accessing the data, see the Access tab.
Access the data on NCI
Download a zipped .tif
Web Map Service (WMS)
Key details
Persistent ID |
|
Licence |
Cite this product
Data citation |
Lymburner, L., Tan, P., McIntyre, A., Thankappan, M., Sixsmith, J. 2015. Dynamic Land Cover Dataset Version 2.1. Geoscience Australia, Canberra. https://pid.geoscience.gov.au/dataset/ga/83868
|
Publications
Lymburner, L., Tan, P., McIntyre, A., Thankappan, M., Sixsmith, J. 2015. Dynamic Land Cover Dataset Version 2.1. Geoscience Australia, Canberra. https://pid.geoscience.gov.au/dataset/ga/83868
Background
This product will be deprecated. It has been replaced by the current DEA Land Cover (Landsat) product.
Land cover is the observed biophysical cover on the Earth’s surface including trees, shrubs, grasses, soils, exposed rocks and water bodies, as well as anthropogenic elements such as plantations, crops and built environments.
Land cover changes for many reasons, including seasonal weather, severe weather events such as cyclones, floods and fires, and human activities such as mining, agriculture and urbanisation.
Remote sensing data recorded over a period of time allows the observation of land cover dynamics. Classifying these responses provides a robust and repeatable way of characterising land cover types.
What this product offers
The Dynamic Land Cover Dataset is the first nationally consistent and thematically comprehensive land cover reference for Australia. It provides a base-line for reporting on change and trends in vegetation cover and extent.
The dataset presents a synopsis of land cover information for every 250m by 250m area of the country from January 2002 to December 2015.
The dataset shows Australian land covers clustered into 22 land cover classes. These reflect the structural character of vegetation, ranging from cultivated and managed land covers (crops and pastures) to natural land covers such as closed forest and open grasslands.
Applications
The primary purpose of the DLCDv2.1 product is to provide the Australian government with a standardised land cover dataset for understanding of and reporting on land cover change, including to better understand how managed landscapes have responded to droughts, floods and shifts in water allocations. An example application is use within the Australian Bureau of Statistics’ Land Accounts.
The product has many secondary uses. For example climate and weather modellers will be able use DLCDv2 to input land cover parameters into climate and weather models. Ecologists, decision makers and carbon modellers will be able to use DLCDv2 to assess how vegetation responds to disturbance including severe fires, floods, cyclones and land clearing activities. The DLCDv2 can also be used as a contextual layer for products such as the Atlas of Living Australia.
Information about land cover dynamics is essential to understanding and addressing a range of national challenges such as drought, salinity, water availability and ecosystem health. This product can be used as an input for a wide range of environmental modelling applications, including:
Climate
Wind and water erosion risk
Evapotranspiration
Carbon dynamics
Land surface processes
Technical information
The Dynamic Land Cover Dataset uses a standard land cover classification to show the change in behaviour of land cover across Australia. The DLCD includes data for every 250m by 250m area on the ground, for the period 2002 to 2015. The DLDC provides a basis for reporting on change and trends in vegetation cover and extent. Information about land cover dynamics is essential to understanding and addressing a range of national challenges such as drought, salinity, water availability and ecosystem health.
The current release of the second version DLCDv2.1 (described in this document) presents land cover information for every 250m by 250m area of the country for each of the two year intervals listed in the table below. It consists of maps based on 2 years of MODIS EVI time-series data. The date ranges for each of the map series are:
Date ranges for each of the map series
Jan 2002–Dec 2003
Jan 2003–Dec 2004
Jan 2004–Dec 2005
Jan 2005–Dec 2006
Jan 2006–Dec 2007
Jan 2007–Dec 2008
Jan 2008–Dec 2009
Jan 2009–Dec 2010
Jan 2010–Dec 2011
Jan 2011–Dec 2012
Jan 2012–Dec 2013
Jan 2013–Dec 2014
Jan 2014–Dec 2015
In conjunction with other data sources, the DLCD can be used to identify emerging patterns of land cover change and provide a spatial and historical context within which to interpret change.
The land cover classification scheme used conforms to the 2007 International Standards Organisation (ISO) land cover standard (19144-2). The dataset shows Australian land covers clustered into 22 classes. These reflect the structural character of vegetation, ranging from cultivated and managed land covers (crops and pastures) to natural land covers such as trees and grasslands.
Features
The Dynamic Land Cover Dataset (DLCD) is a nationally consistent and thematically comprehensive land cover reference for Australia. In producing the DLDC, time series analysis techniques are used to classify each pixel based on the way it has behaved over a two year period. Each map can be considered in isolation, or two maps from different intervals can be compared to identify the changes in land cover that have occurred over that time frame.
Each map has been generated by applying a sophisticated time series analysis technique known as Dynamic Markov Chain modelling to two years of MODIS EVI data. The outputs of the time series analysis are filtered using a class change constraint matrix, a terrain mask and MODIS green albedo products. The maps contain 22 land cover classes as outlined in the table below. The class numbers for DLCDv2 are consistent with DLCDv1 which contained several additional classes. The RGB values listed in the table can be used for display of the dynamic land cover dataset.
Common name |
ISO class descriptor |
Class |
R |
G |
B |
|---|---|---|---|---|---|
No Data |
No Data |
0 |
0 |
0 |
0 |
Mines and Quarries |
Extraction Sites |
1 |
130 |
130 |
130 |
Urban areas |
Urban Areas |
35 |
200 |
200 |
200 |
Lakes and dams |
Inland Waterbodies |
3 |
0 |
70 |
173 |
Salt lakes |
Salt Lakes |
4 |
150 |
225 |
255 |
Irrigated cropping |
Irrigated Cropping |
5 |
90 |
36 |
90 |
Rain fed cropping |
Rainfed Cropping |
8 |
198 |
141 |
153 |
Irrigated pasture |
Irrigated Pasture |
6 |
166 |
38 |
170 |
Rain fed pasture |
Rainfed Pasture |
9 |
226 |
194 |
199 |
Irrigated sugar |
Irrigated Sugar |
7 |
183 |
18 |
52 |
Rain fed sugar |
Rainfed Sugar |
10 |
219 |
77 |
105 |
Wetlands |
Wetlands |
11 |
0 |
178 |
160 |
Alpine meadows |
Alpine Grasses - Open |
15 |
255 |
255 |
255 |
Open Hummock Grassland |
Hummock Grasses - Open |
16 |
255 |
255 |
115 |
Closed Tussock Grassland |
Tussock Grasses - Closed |
14 |
255 |
121 |
0 |
Open Tussock Grassland |
Tussock Grasses - Open |
18 |
255 |
169 |
82 |
Scattered shrubs and grasses |
Shrubs and Grasses - Sparse-Scattered |
19 |
255 |
255 |
190 |
Dense Shrubland |
Shrubs - Closed |
24 |
175 |
136 |
80 |
Open Shrubland |
Shrubs - Open |
25 |
193 |
168 |
117 |
Closed Forest |
Trees - Closed |
31 |
0 |
133 |
0 |
Open Forest |
Trees - Open |
32 |
20 |
194 |
0 |
Woodland |
Trees - Sparse |
34 |
186 |
232 |
96 |
Open Woodland |
Trees - Scattered |
33 |
214 |
255 |
138 |
Lineage
The DLCDv2 is the second DLCD product released by GA. It is based on the MODIS Enhanced Vegetation Index (EVI) product MOD13Q1. For more information on MOD13Q1 see: https://lpdaac.usgs.gov/products/modis_products_table/mod13q1.
The first version of the DLCD product suite (DLCDv1) was published in 2011 and was a single map based on 250 metre resolution MODIS Enhanced Vegetation Index (EVI) data acquired between April 2000 and April 2008.
Processing steps
Generating Time Series for DLCD The MOD13Q1 data for each 16 day interval were concatenated into a data cube to enable retrieval of a time series of EVI values for an individual pixel.
Time series noise removal The EVI data contain occasional spikes and dips that do not represent biophysical changes and are not captured by the data quality flags. These anomalous points were removed using the spike removal algorithm outlined in Lymburner et al. (2011).
DLCD Time Series Analysis The MODIS EVI data cube is analysed to characterise the time series trends for each pixel. This process represents the time series in a form that allows it to be classified more easily. The initial characterisation of the time series data involves these steps:
Piece-wise Linear Segmentation
The time series segmentation algorithm approximates a time series using a series of piece-wise linear segments. Each segment is characteristic of a sequence of environmental behaviour that typifies the associated land cover class.
Sub-sequence Discretization
Each segment is then detailed by three values describing its starting value, slope and length to form a vector input to the classification process.
Sequence Labelling
The sequences are then clustered into groups of like behaviour, and each group then assigned a behaviour label. A time series is thus transformed from a large collection of varying values to a smaller set of behaviour types, joined as a kind of “DNA” string representing the pixel through time.
Markov modelling
The DNA string provides an initial class which is then modelled as a dynamic Markov Chain to estimate the likelihood that a particular land cover class would occur after any other land cover class.
Bayesian classification
The final class is then assigned using a Bayesian classifier.
References
Lymburner, L., Tan, P., McIntyre, A., Thankappan, M., Sixsmith, J. 2015. Dynamic Land Cover Dataset Version 2.1. Geoscience Australia, Canberra. https://pid.geoscience.gov.au/dataset/ga/83868
Accuracy
The accuracy of the dataset has been assessed using over 30,000 field sites distributed across all states and territories of Australia. The data was provided by Federal, State and Territory Government agencies and collected over the period 2002 to 2012 including data contributed from these sources:
Australian Bureau of Agricultural and Resource Economics and Sciences (ABARES) Riverina Plains Data
Australian Agricultural and Grazing Industries Survey (AAGIS)
Commonwealth Scientific and Industrial Research Organisation (CSIRO) Colleambally Data
Department of Agriculture, Fisheries and Forestry (DAFF) rapid assessment sites
New South Wales Land Practices
Queensland Herbarium CorVeg
Sunrise21
Victorian State Forest Resouce Inventory (SFRI) field data
Victorian Land Use Information System (VLUIS)
Western Australian Department of Environment and Conservation
Western Australian WARM
The field site data has been collected for a variety of purposes and is accurate to varying spatial and temporal resolutions; typically the primary field site data are no longer available. A process of translation between the field data collected and the dynamic land cover data was undertaken using expert knowledge.
Due to the unknown spatial, temporal and thematic accuracy of the field site data the assessment with the dynamic land cover dataset has been reported only for broad themes across all years.
Theme |
Map accuracy |
User accuracy |
|---|---|---|
Crops and Pastures |
98.95% |
86.44% |
Grasses |
29.00% |
62.73% |
Shrubs |
5.22% |
4.69% |
Trees |
62.55% |
72.34% |
The overall accuracy of DLCD assessed using the grouped themes is 81.5%.
The field data comparison demonstrates that for cover classes that are poorly represented by a greenness measure, the associated accuracy of the DLCD is very poor. However for cover classes with significant greenness, the grouped accuracy of DLCD is reasonably high. In addition, more dynamic classes such grasses and shrubs show a lower accuracy when assessing a single date field data point against the general class over a two year period.
The complete error matrix, assessing the full 22 class DLCD against field data is available to download. The full matrix highlights the disparity of the 250 m DLCD versus the field data, and shows those classes that are not characterisable using the EVI greeness measurements. The overall accuracy using the finer class structure is 31.1%.
Despite the large number of points in the comparison this comprises less than 0.01% of the land cover classification data.
Additionally, the 250 metre pixel scale of the data will limit the use of this data set in studies that depend on the identification of small or detailed features within the landscape i.e. narrow strips of riparian vegetation or managed landscapes where the fields/paddocks are smaller than 250 x 250 metres.
The two year time frame for each map in the map series will limit the capacity to detect short lived changes in land cover such as low-intensity bushfires i.e. the canopy may recover within a two year period. The map series will only provide limited information for land covers that are difficult to discriminate using EVI such as sugar cane.
Access the data
Get the data online |
Learn how to access the data via AWS |
|
Get via web service |
Learn how to use DEA’s web services |
Old versions
No old versions available.
Changelog
The DLCDv2 is the second DLCD product released by GA. It is based on the MODIS Enhanced Vegetation Index (EVI) product MOD13Q1. For more information on MOD13Q1 see: https://lpdaac.usgs.gov/products/modis_products_table/mod13q1.
The first version of the DLCD product suite (DLCDv1) was published in 2011 and was a single map based on 250 metre resolution MODIS Enhanced Vegetation Index (EVI) data acquired between April 2000 and April 2008.
License and copyright
© Commonwealth of Australia (Geoscience Australia).
Released under Creative Commons Attribution 4.0 International Licence.